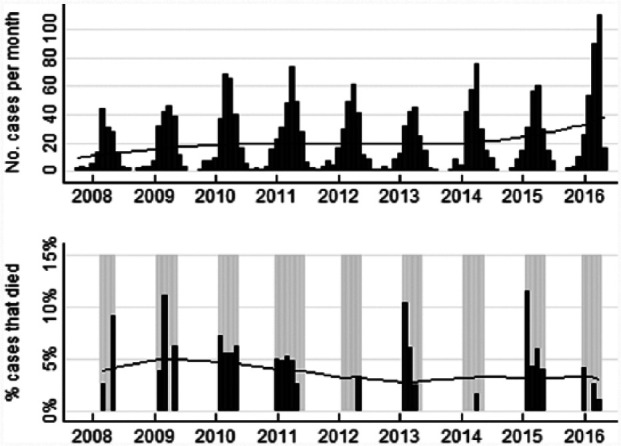
Figure 1.

Numbers of cases, and percentages of cases that died on or before day 5 after presentation to the Animal Emergency Service, by month and year. Total number of cases = 2077; percentages of cases that died are shown only for months with at least 20 cases for which mortality outcome was known (grey-shaded months). Years are centred on mid-winter (July; shown as vertical marks). Lines are locally weighted regression (lowess) lines. For percentages of cases that died, the lowess line used all months where results are shown but disregarded the sizes of the denominators in those months
