
Figure 2.
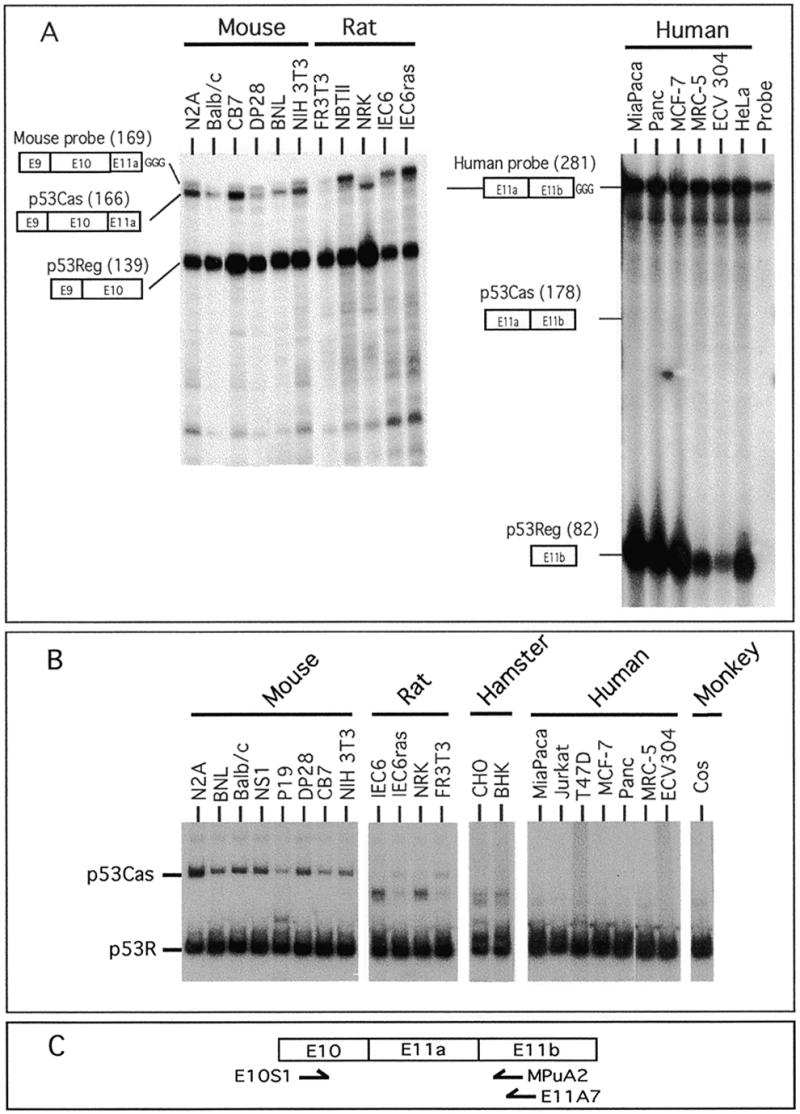
Analysis of p53 mRNA levels in cell lines. (A) Analysis of expression of the p53Cas and p53Reg mRNAs in different cell lines by RNase protection assay. The mouse (MT7C-E9) and human (H7E-PuI) probes used are depicted schematically (see Materials and Methods). The sizes of the protected fragments in nucleotides are indicated in parentheses. The 169 nt band located just above the p53Cas protected fragment (166 nt) represents the undigested probe. (B) Analysis of expression of the p53Cas and p53R mRNAs in different cell lines by RT–PCR. The identity of the amplified PCR fragment corresponding to the two p53 isoforms is indicated. The band located between the p53Cas and the p53R bands in some lanes corresponds to a spurious PCR artifact. (C) Diagrammatic representation of the p53 oligonucleotides used in the RT–PCR analysis shown above. Reverse transcription of cytoplasmic RNA was done using the E11A7 oligonucleotide primer for mouse, hamster and rat RNA or the MPuA2 oligonucleotide primer for human and monkey RNA. PCR amplification was performed using the primers E10S1 and MPuA2.