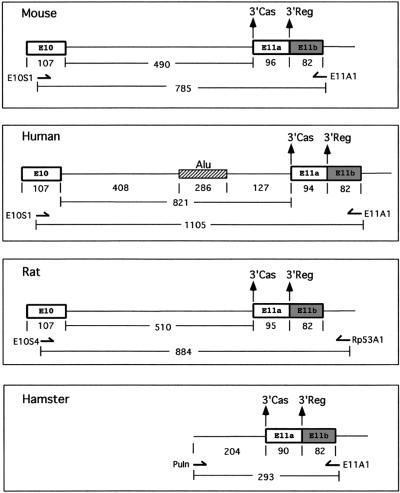
Figure 3.
Diagrammatic representation of the PCR amplification products used for DNA sequencing of the mouse, human, rat and hamster p53 exon 10–exon 11 region. The p53-specific oligonucleotides are indicated by arrows. The sizes of the PCR amplification products are shown below the oligonucleotides.

