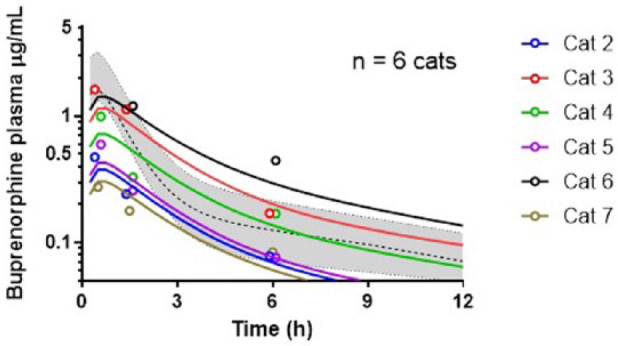
Figure 3.

Plot of the buprenorphine concentration (μg/ml) in cats with gingivostomatitis and normal cats after receiving 0.02 mg/kg of buprenorphine buccally. For the cats with gingivostomatitis, coloured circles represent the individual measured plasma concentrations and coloured lines the most likely plasma concentration–time profile as informed by the pharmacokinetic model. For reference, the dashed line and grey area represent the median concentration and area between the minimum and maximum plasma concentration observed by Hedges et al26 after administration of the same dose of buprenorphine buccally in healthy cats
