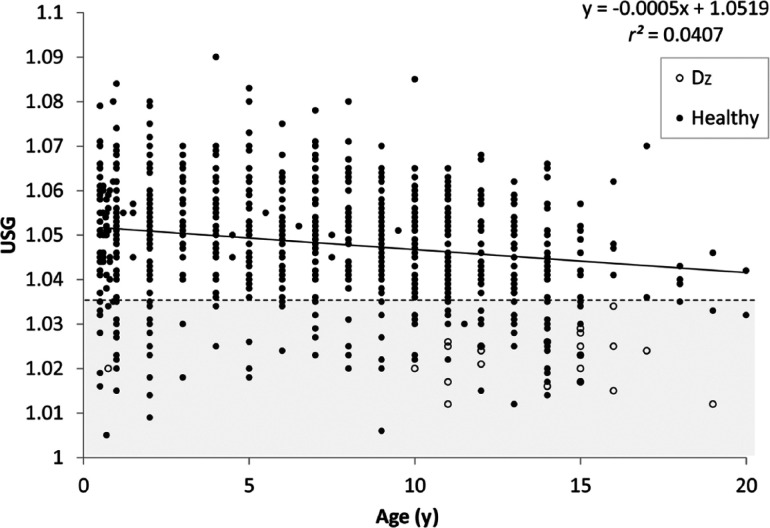
Figure 3.
Relationship between age and urine specific gravity (USG) in 976 apparently healthy adult cats. Black circles represent apparently healthy cats without identifiable disease; open circles represent cats with identified pathology that could explain a USG of <1.035. The dashed line and shaded region encompasses USG <1.035. The regression equation was derived after excluding cats with pathology (open circles). Dz = Disease

