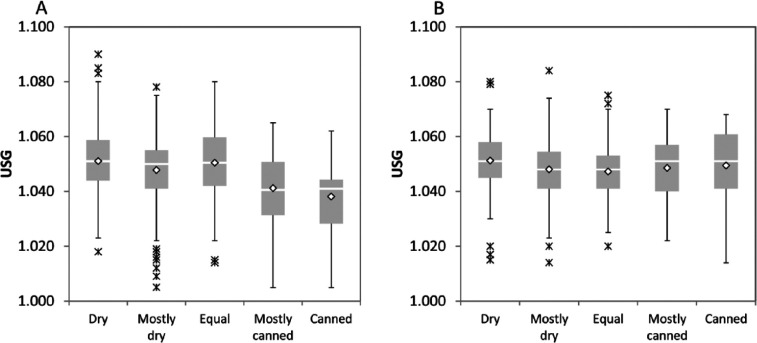
Figure 4.
Box-and-whisker plots of urine specific gravity (USG) in cats fed different diets. (a) Female cats; (b) male cats. Gray boxes represent the interquartile range (IQR), horizontal lines represent the median, diamonds represent the mean, whiskers represent data within 1.5 × IQR of the median and asterisks represent data outside 1.5 × IQR of the median

