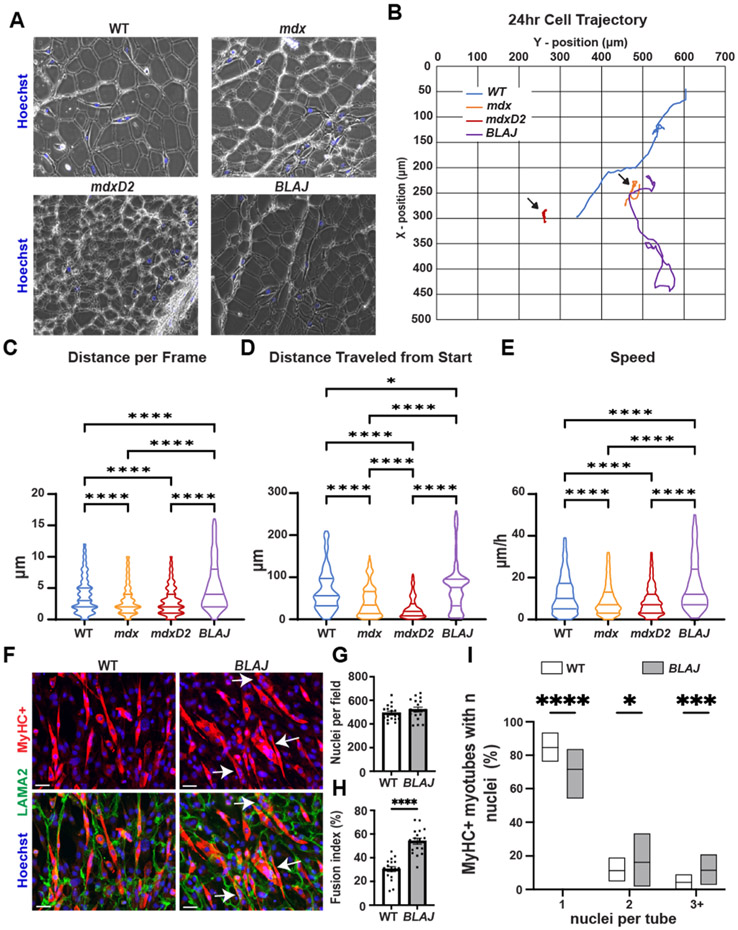
Fig. 7.
mdx myoscaffolds inhibit C2C12 myoblasts movement while BLAJ myoscaffolds enhance C2C12 myoblast movement and differentiation. (A) Representative phase contrast images of C2C12 myoblasts seeded onto dECMs from WT, mdx, mdxD2, and BLAJ mice. (B) Blue (WT), orange (mdx), red (mdxD2), and purple (BLAJ) lines depict cellular movement trajectory over 24 h. Quantification of C2C12 cell movement demonstrated a significant difference in (C) distance per frame (WT 3.91, mdx 3.10, mdxD2 2.98, and BLAJ 5.41 μm), (D) distance traveled from start position (WT 69.24, mdx 43.99, mdxD2 27.12, and BLAJ 76.78 μm), and (E) speed (WT 11.89, mdx 9.31, mdxD2 8.80, and BLAJ 16.34 μm/h) among the WT and dystrophic myoscaffolds. Myoscaffolds prepared from two mice per genotype; n = 73 images per cell, with 8–11 myoblasts tracked per genotype. C2C12 cells were seeded onto WT and BLAJ dECM scaffolds and allowed to differentiate for 96 hrs. (F) Representative IFM images of MyHC+ (red) with LAMA2 (green) demonstrate increased myoblast differentiation in cells seeded on the BLAJ dECM. Scale Bars 100 μm. (G) Equal numbers of nuclei per field were present on WT or BLAJ dECMs. (H) Muscle fusion index was increased on BLAJ myoscaffolds. (I) Significantly increased percentage of MyHC + myotubes with 2 and 3+ nuclei per myotube present on BLAJ dECMs compared to WT. Graphs show the mean with SEM bars. * p < 0.5, ** p < 0.01, *** p < 0.005, and **** p < 0.001 by one-way ANOVA.

