
Figure 1 |. hΔB neurons signal Drosophila’s allocentric traveling direction.
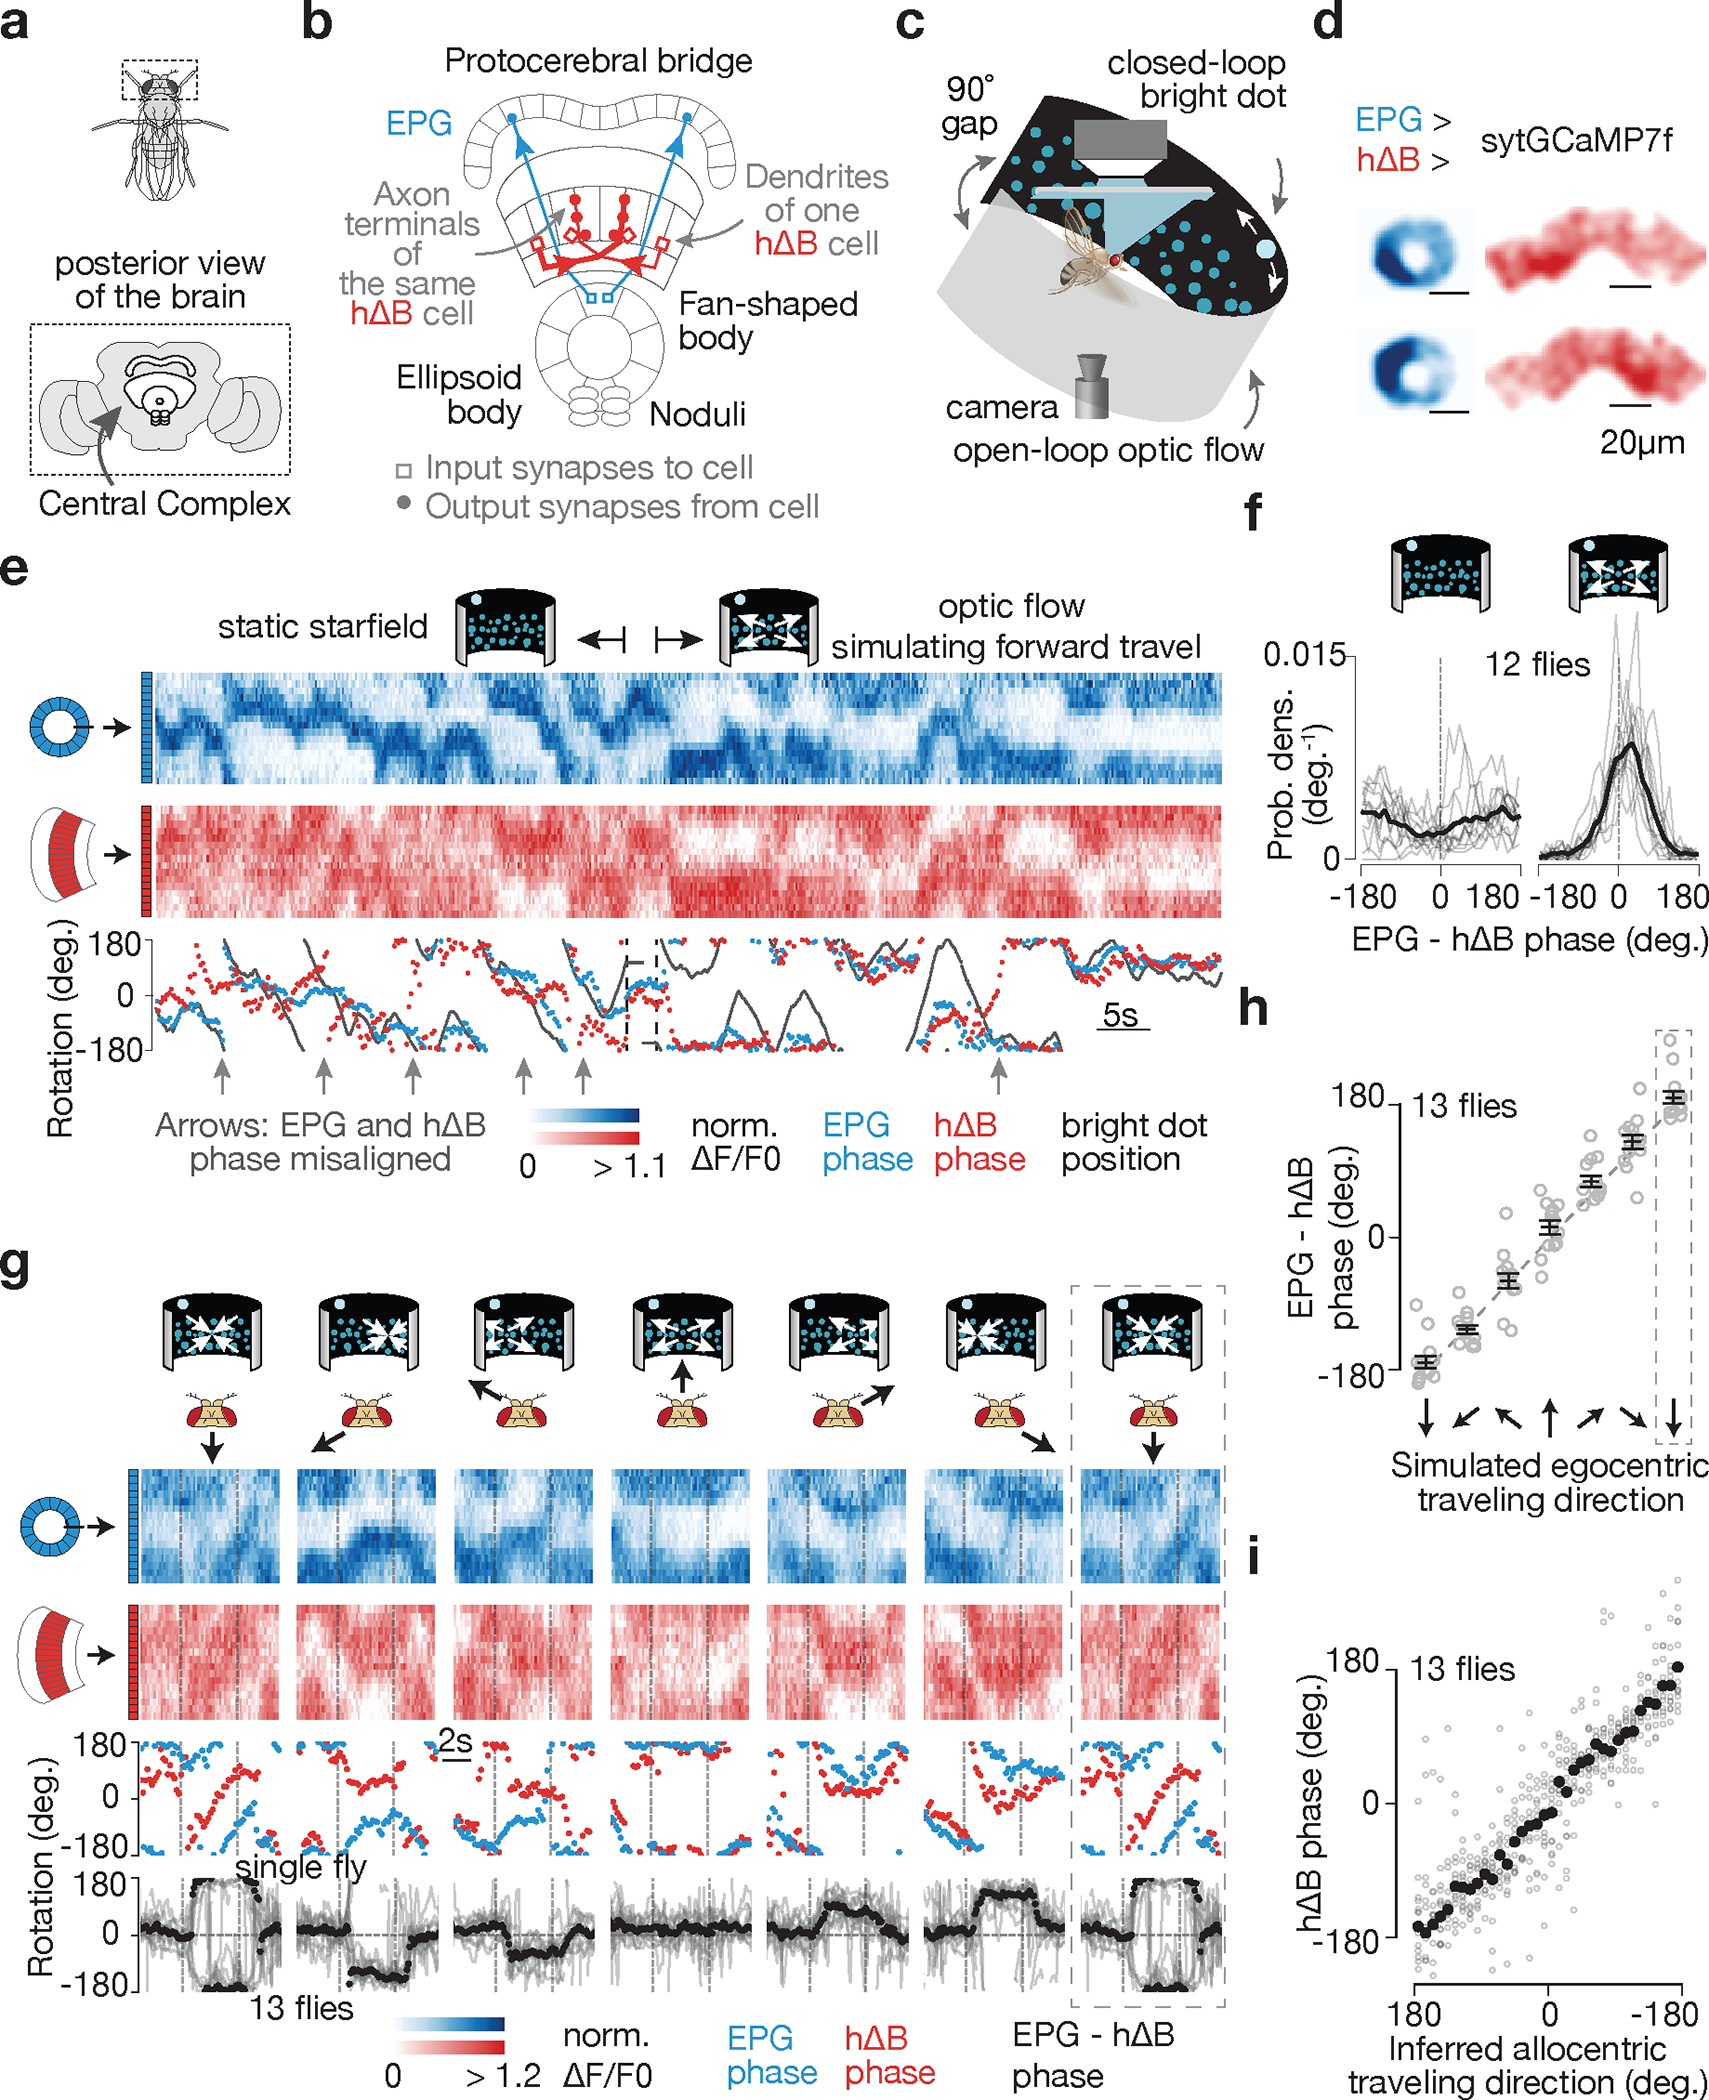
a, Fly brain. b, Two example EPGs and two example hΔBs. Each cell type tiles the central complex c, Imaging neural activity in a flying fly with an LED arena. d, sytGCaMP7f frames of the EPG bump in the ellipsoid body and the hΔB bump in the fan-shaped body. e, Simultaneously recorded sytGCaMP7f signal from EPGs (blue) and hΔBs (red) in a flying fly. Top: [Ca2+] signal; bottom: phase estimates and dot position. Gray regions represent the 90° gap in the back of the arena. f, Distributions of EPG – hΔB phase without and with optic flow. Gray: single fly means. Black: population mean. g, Top, EPG (blue) and hΔB (red) sytGCaMP7f signal in a sample flying fly experiencing optic-flow with foci of expansion that simulate the following directions of travel (in the time period delimited by the vertical dashed lines): 180° (backward), −120°, −60°, 0° (forward), 60°, 120°, 180° (backward; repeated). Middle, phases of the sample [Ca2+] signals above. Bottom, circular mean of EPG – hΔB phase for a fly population. Gray: single fly means. Black: population mean. Dotted rectangle: repeated-data column. h, EPG – hΔB phase versus the egocentric traveling direction simulated by optic flow. Circular means were calculated in the final 2.5 s of optic-flow presentation. Gray: individual fly means. Black: population mean and s.e.m. Dotted rectangle: repeated-data column. i, hΔB phase versus the inferred allocentric traveling direction, calculated by assuming that the EPG phase indicates allocentric heading and adding to this angle, at every sample point, the optic-flow angle. Same data as in panels g-h. Gray: individual fly means. Black: population mean. (Note flipped x-axis indicating that the hΔB bump tracks the negative of the fly’s traveling direction; Methods).