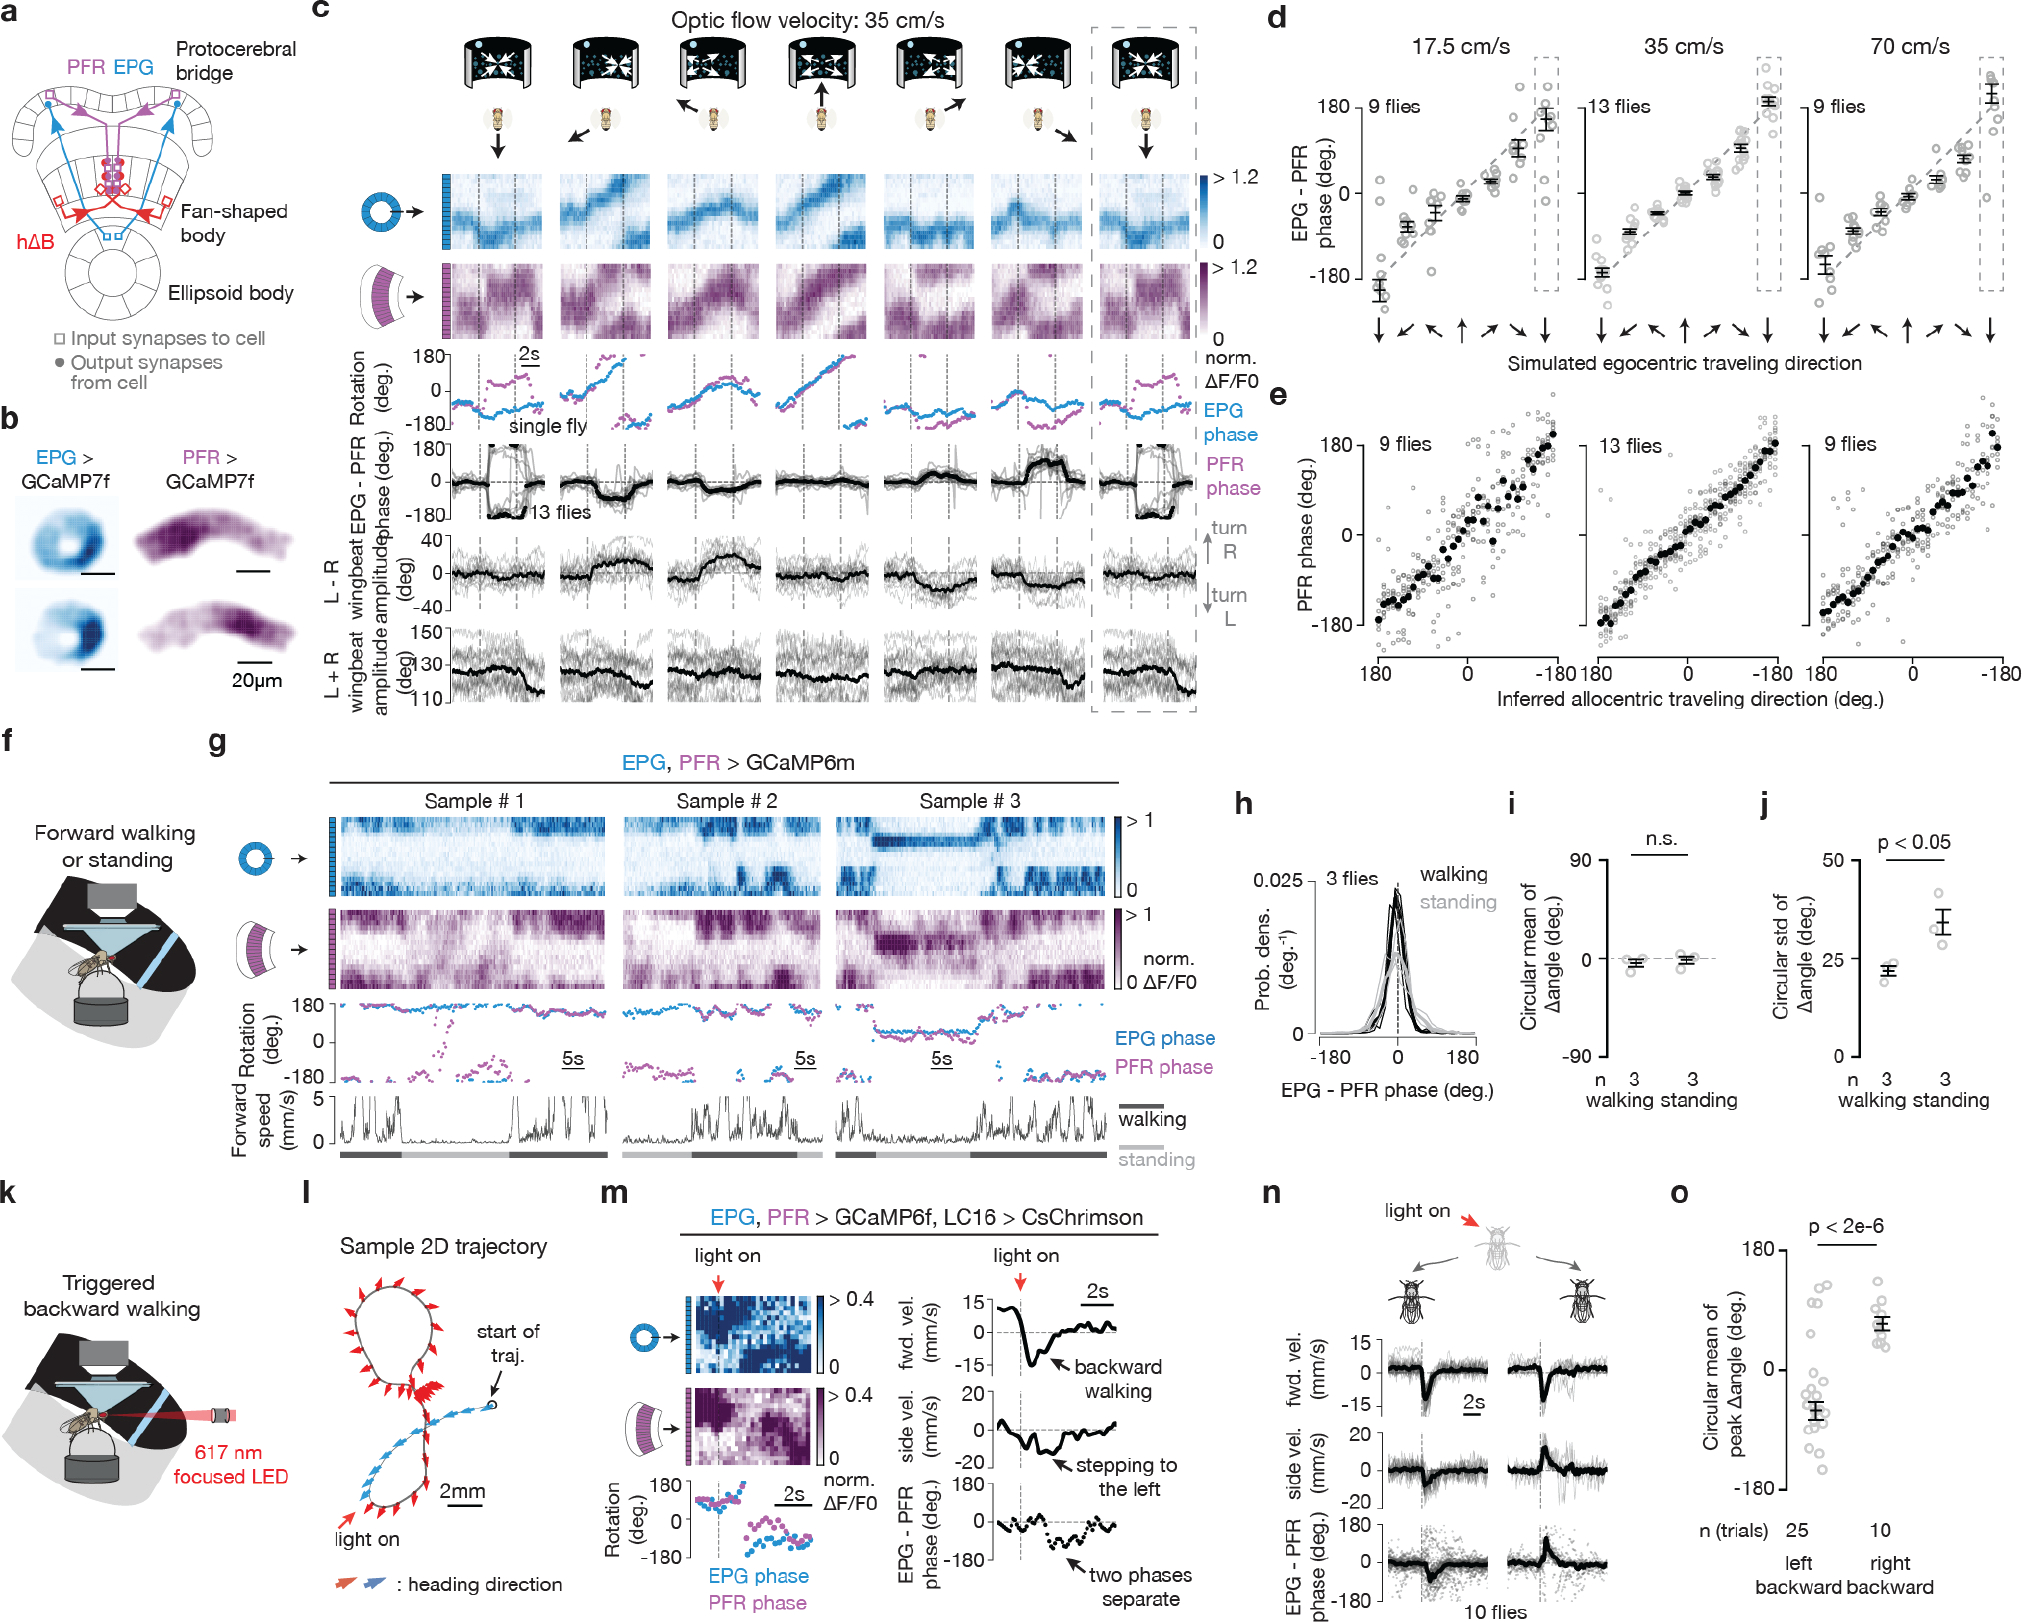
Extended Data Figure 7 |. PFR neurons track a variable similar to allocentric traveling direction in walking and flying flies.

a, Schematics of two example EPG cells, two example PFR cells and two example hΔB cells, which are the anatomically dominant input to PFRs. b, Sample GCaMP7f frames of the EPG bump in the ellipsoid body and the PFR bump in the fan-shaped body. c, Top, EPG (blue) and PFR (purple) GCaMP7f signal in a tethered, flying fly experiencing optic-flow (in the time window bracketed by the vertical dashed lines) with foci of expansion that simulate the following directions of travel: 180° (backward), −120°, −60°, 0° (forward), 60°, 120°, 180° (backward; repeated data). Third row, EPG and PFR phases extracted from the above [Ca2+] signals. Fourth row, circular-mean phase difference between EPGs and PFRs. Bottom two rows, average of left-minus-right and left-plus-right wingbeat amplitude. Single fly means: light gray. Population means: black. Dotted rectangle indicates a repeated-data column. d, EPG – PFR phase as a function of the egocentric traveling direction simulated by the optic flow, at three different speeds. Circular means were calculated in the last 2.5 s of optic flow presentation. Gray: individual fly circular means. Black: population circular mean and s.e.m. Dotted rectangle indicates a repeated-data column. (See Methods for how we calculate the optic flow speed.) Note that the data points deviate slightly from the unity line in a manner that means that the PFR phase is slightly shifted away from the traveling direction indicated by the optic flow and toward a frontal heading direction. The hΔB data in Figure 1h does not show this deviation from unity. We performed two-tailed one-sample t-tests against the diagonal line for data points in the ±60° and ±120° columns for the 35 cm/s data from PFRs here and the 35 cm/s data from hΔBs in Figure 1h. For the PFR results on the left of panel d, P values are 4.7e-5, 4.7e-5, 5.4e-4 and 9.1e-3 for the −120°, −60°, +60° and +120° columns, respectively. For the hΔB results in Figure 1h, P values are 0.39, 0.88, 0.058 and 0.44 for the −120°, −60°, +60° and +120° columns, respectively. e, PFR phase as a function of the inferred allocentric traveling direction, calculated by assuming that the EPG phase indicates allocentric heading direction and adding to this angle, at every sample point, the optic-flow angle. Gray: individual fly means. Black: population mean. In panel d and e, data from the middle column (35cm/s) were the same as in panel c. f, Tethered, walking, [Ca2+]-imaging setup with a bright blue bar that rotates in closed loop with the fly’s turns. g, Sample time series of simultaneously imaged EPG and PFR bumps in a tethered, walking fly. Top two traces show [Ca2+] signals. Third trace shows the phase estimates of the two bumps. Bottom trace shows the forward speed of the fly. h, Probability distributions of the EPG – PFR phase in walking and standing flies. Thin lines: single flies. Thick line: population mean. i, Circular mean of the EPG – PFR phase in walking and standing flies. WatsonWilliams multi-sample tests, P>0.63 when comparing any experimental group with 0°. Gray dots: single fly values. Black bars: population means ± s.e.m. j, Same as panel i, but plotting circular standard deviation. Two-tailed unpaired t-tests were performed. P value equals 0.042. k, Tethered-walking setup where we used a 617 nm LED focused on the center of the fly’s head to optogenetically trigger backward walking via activation of LC16 visual neurons expressing CsChrimson47 (Methods). l, An example 2D trajectory of optogenetically triggered backward walking. An arrow is shown every ~0.1 seconds. Red arrows indicate backward walking during the red-light pulse; blue arrows indicate the 1.2 s before the red light turned on. m, Left, time series of EPG (blue) and PFR (purple) bumps and phase-estimates from the trajectory in panel l. Right, time series of forward velocity, sideslip velocity and the difference between the PFR and EPG phase in the trajectory shown in panel l. The ΔF/F heatmap range is more compressed here than in other plots because the PFR signal strength typically dips when the fly initiates backward walking (a phenomenon whose mechanism we have not yet explored). Nevertheless, clear moments where the PFR phase separates from the EPG phase are evident, even after the PFR signal strength has recovered, in this sample trace (and in others). n, Time series of the mean forward velocity, mean sideslip velocity and the circular mean of the difference between the PFR and EPG phase during backward walking, grouped by optogenetic trials in which the fly walked to the back left (left panel) or to the back right (right panel). The sign of PFR-EPG phase deviations seen here, in walking, are consistent with the signs observed in flight, for the same directions of backward-left and backward-right travel. Thin lines and gray dots: individual trials. Thick line and black dot: population mean (circular mean for bottom row). o, Circular mean and s.e.m. of the peak EPG – PFR phase during triggered left-backward and right-backward walking bouts (0.6 s to 1.4 s after the dashed lines in panel n). Watson-Williams multi-sample tests were performed and P value equals 1.6e-6.
