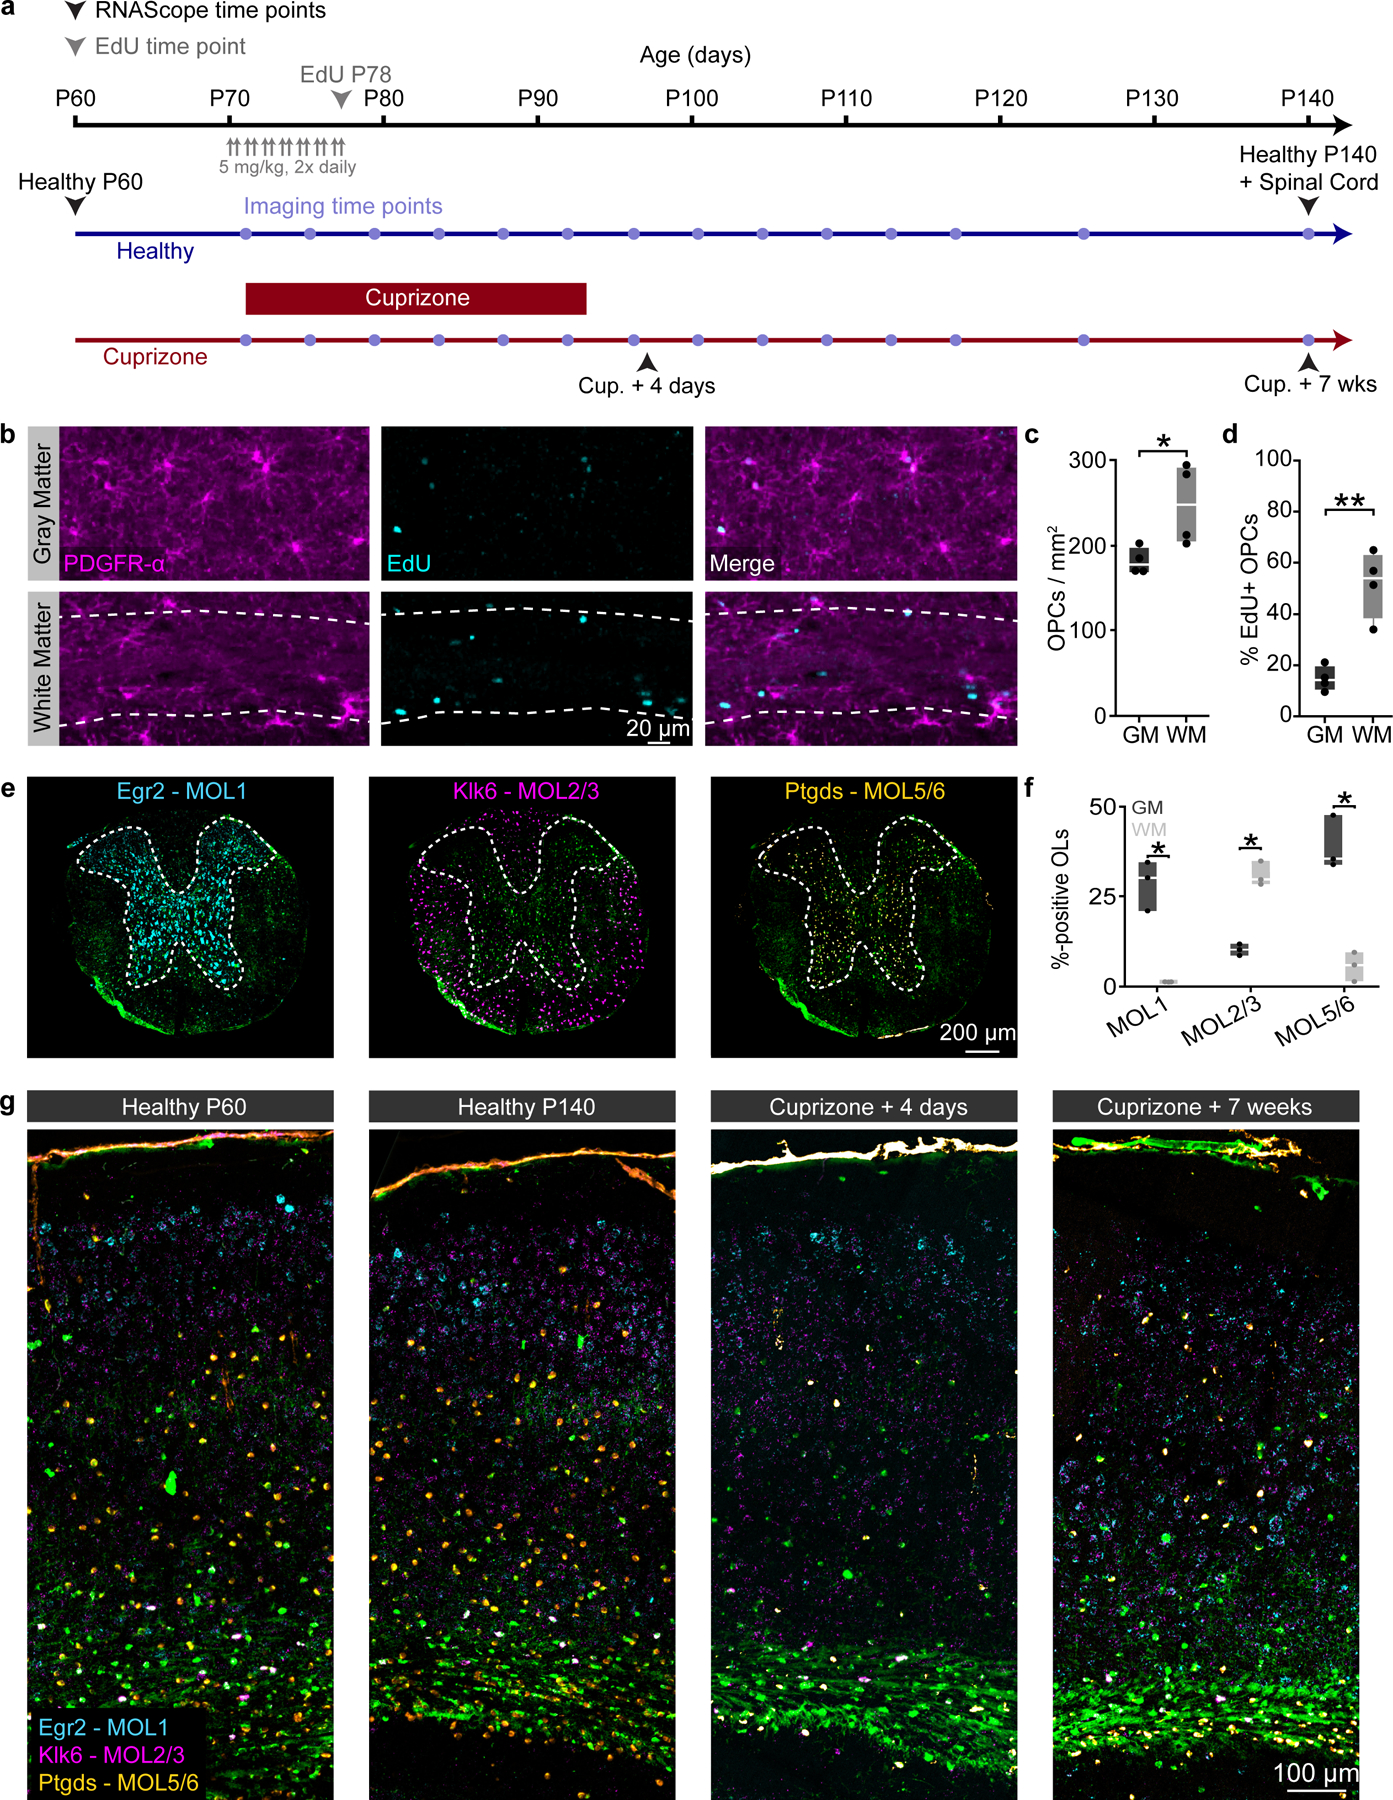
Extended Data Fig. 7 |. Immunofluorescent and in situ hybridization techniques allow for probing OPC proliferation and oligodendrocyte subpopulations in the cortex and subcortical white matter.

a) Experimental timeline of tissue collection for EdU and RNAScope analyses in healthy and cuprizone mice. Healthy MOBP-EGFP mice were injected with 5 mg/kg of the thymidine analog EdU twice a day (10–12 hr. interval) for seven days starting at P70 and perfused the following day. Healthy MOBP-EGFP mice were perfused at P60 and P140 to assess aging-dependent changes in adult oligodendrocyte subpopulations. MOBP-EGFP mice that were fed 0.2% cuprizone for three weeks were perfused at 4 days post-cuprizone removal (peak demyelination, matched to in vivo imaging data, Fig. 4), and 7 weeks post-cuprizone removal (regeneration, matched to the final time point of in vivo imaging, see timeline, Fig. 4). b) EdU-positive proliferated OPCs in the posterior parietal cortex (top, GM) and subcortical white matter (bottom, WM, dashed border). c) The density of PDGFR-α-positive OPCs was significantly increased in the WM compared to the GM (248.6 ± 23.8 vs. 181.2 ± 7.7, Unpaired, two-tailed Student’s t-test for equal variance, t(6) = 2.69, p = 0.036). d) The percentage PDGFR-α+/EdU+ OPCs is increased in the WM compared to the GM (Unpaired, two-tailed Student’s t-test for equal variance, 51.6 ± 6.6 vs. 14.6 ± 2.5, t(6) = 5.29, p = 0.002). e) Coronal sections from the mid-thoracic spinal cord of healthy MOBP-EGFP mice were taken at P140 and run in parallel with brain sections to confirm the labeling specificity of our oligodendrocyte subpopulation probe-set (Egr2, MOL1, cyan; Klk6, MOL2/3, magenta; Ptgds, MOL5/6, orange). f) Egr2 and Ptgds preferentially label oligodendrocytes in the spinal gray matter, while Klk6 predominantly labels oligodendrocytes in the spinal white matter (Unpaired, two-tailed students t-test for unequal variance). g) Coronal sections from the posterior parietal cortex of MOBP-EGFP mice (−1.7 to −2.3 mm posterior and 1 to 3 mm lateral to bregma) showing the pattern of OL subpopulation labeling at the experimental time points described in (a). *p < 0.05, **p<0.01, n = 4 mice, 4 sections per mouse. Boxplots represent the median, interquartile range and the minimum and maximum values. For detailed statistics, see Supplementary Table 3.
