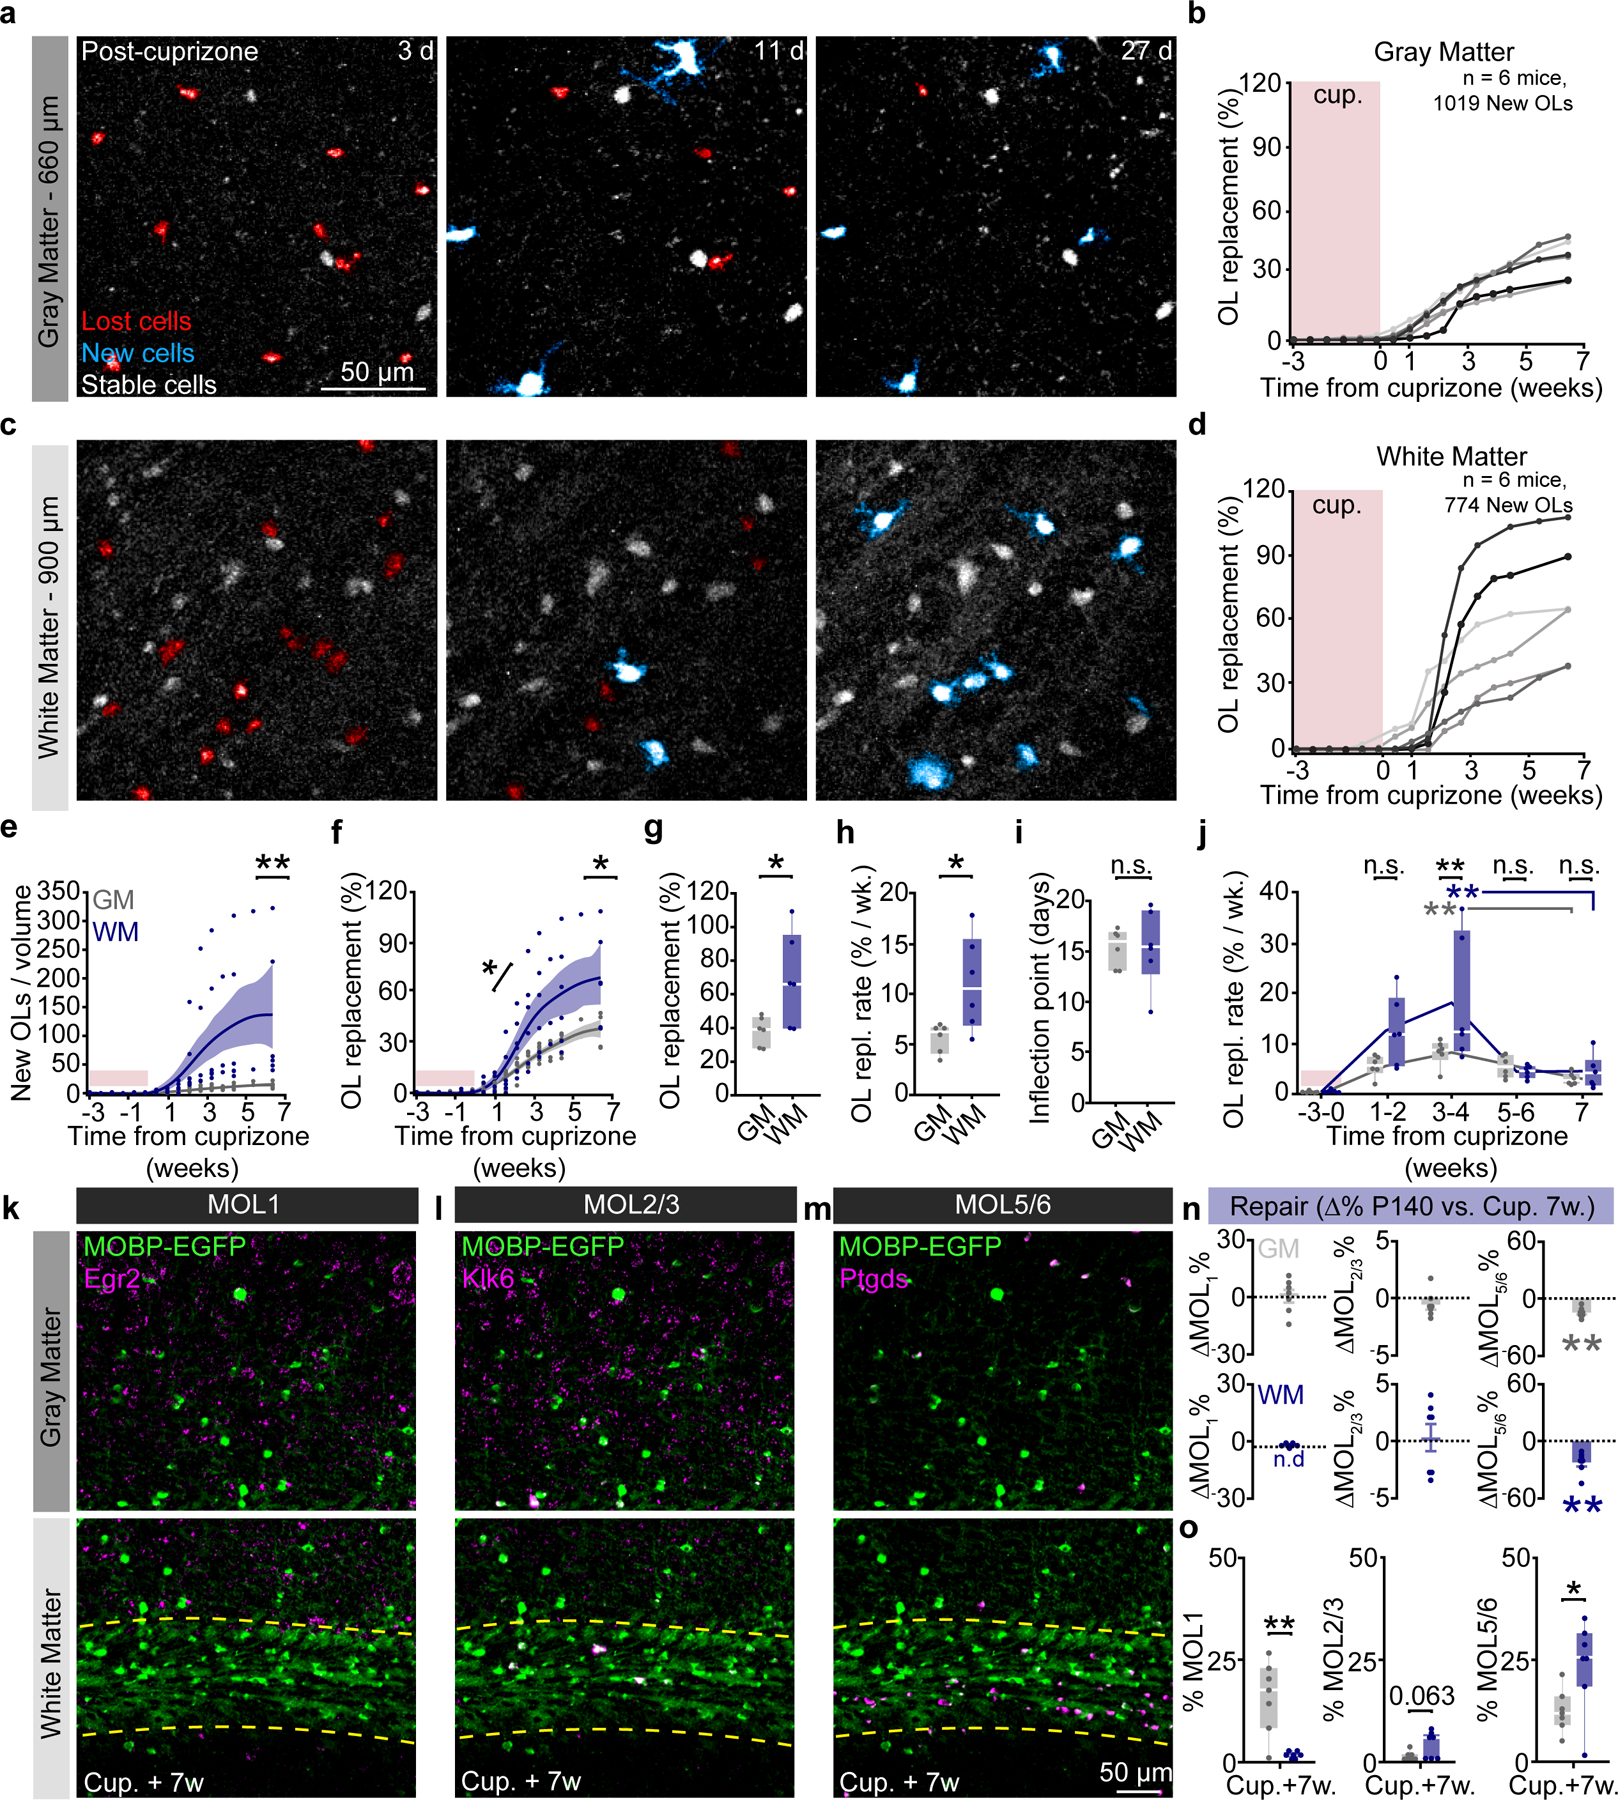
Figure 6 |. Oligodendrocyte replacement is enhanced in the white matter and partially restores regional heterogeneity.

a) Timelapse of 24-day period after cuprizone cessation showing OL loss (red), followed by OL regeneration (cyan) in the deep PPC. b) Cumulative OL replacement (%-gain normalized to %-loss) across the cortex for individual mice. c) Same time points and mouse as in (a) in the corpus callosum. d) Cumulative OL replacement for individual mice in the WM. e) Density of newly-generated OLs was increased in the WM vs. GM (p=0.005). Note the high variability without normalization to OL loss. f) Cumulative OL replacement over time in WM vs. GM. Significance asterisks represent data in (g) and (h). g) OL replacement (%) is significantly increased at 45 days post-cuprizone in the WM (p=0.043). h) Rate of replacement is enhanced in the WM vs. GM (p=0.043). i) No difference in the timing of OL replacement between GM and WM. j) The rate of GM and WM population replacement binned by 1–3-week intervals with respect to cuprizone treatment. OL replacement rate is increased in the WM vs. GM at 3–4-weeks post-cuprizone (p=0.0009, black asterisks). Both the WM and the GM are significantly increased at the 3–4-week phase compared to the 7-week plateau phase (p=0.002, Weeks 3–4 vs. 7, GM; p=0.0052 Weeks 3–4 vs. 7, WM). k-m) Images of the distribution of MOL1, MOL2/3, and MOL5/6 OL populations in the PPC and WM at 7 weeks post-cuprizone. n) Change in the population proportions from healthy P140 to 7 weeks post-cuprizone (p=0.003, MOL5/6 GM; p=0.007, MOL5/6 WM). o) GM vs. WM differences in transcriptional heterogeneity 7-weeks post-cuprizone (p=0.005, MOL1; p=0.063, MOL2/3; p=0.032, MOL5/6) Data in h,i were calculated from the parameters of the Gompertz growth curves. Data in a-j represent n=6 mice per group, n-o represent n=7 mice (Cup.+7w.) and n=8 mice (Healthy P140), two sections per mouse. *p<0.05, **p<0.01, n.s., not significant; for growth curves, cubic splines approximate the measure of center and error bars are 95% confidence intervals; box plots represent the median, interquartile ranges and minimum/maximum values; line plots connect the mean at each time point. Statistical tests were unpaired, two-sided Student’s t-tests for equal or unequal variance (g, h, n, o), Dunnett’s multiple comparisons with control (within-groups, j), Two-way ANOVA with Bonferroni correction for piecewise multiple comparisons (between-groups, j) and two-sided Wilcoxon rank sum (e, n). For detailed statistics, see Supplementary Table 3.
