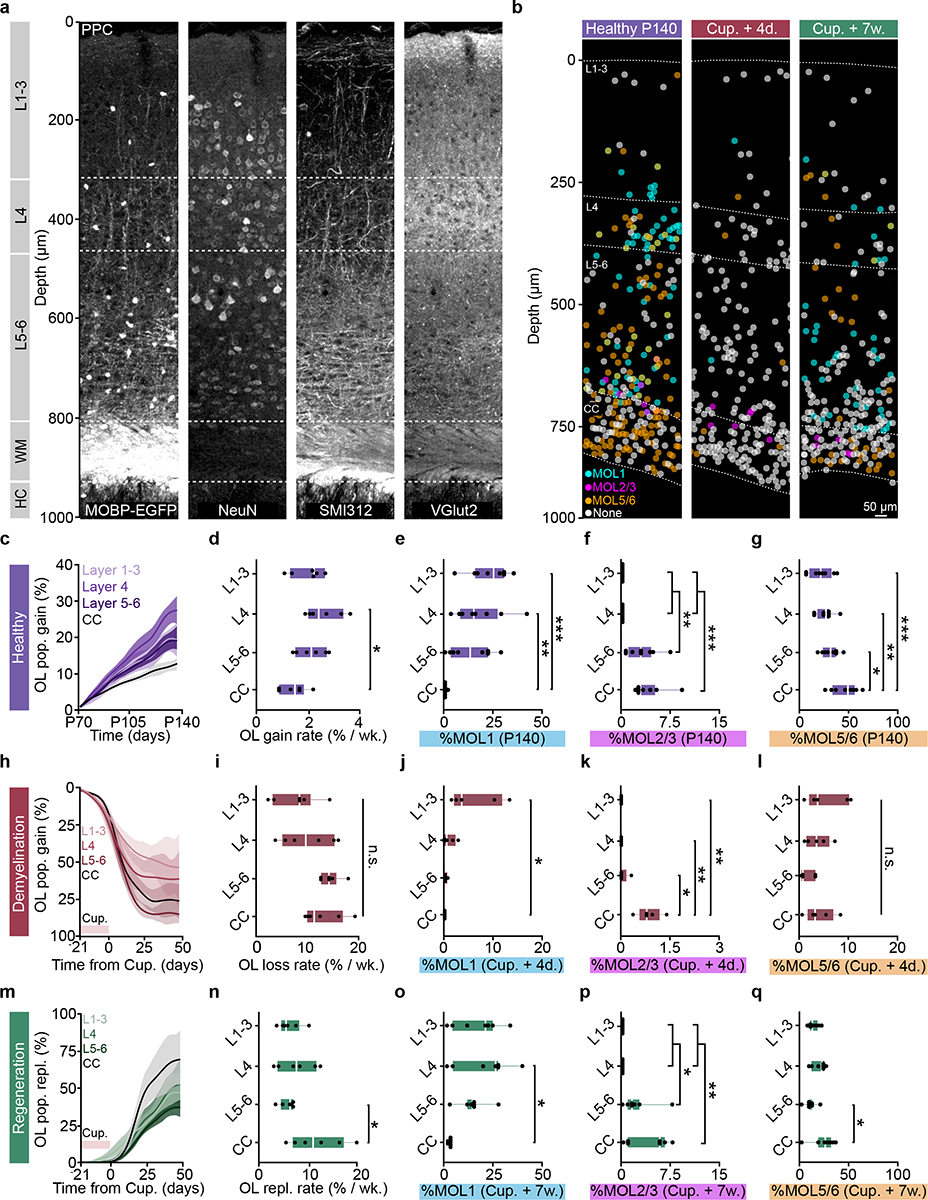
Figure 7 |. Layer-specific differences in oligodendrogenesis correlate with changes in molecular heterogeneity.

a) Myelo-, neuronal, axonal, and thalamic input architecture of the PPC and subcortical WM. Note the Vglut2-positive layer 4.b) Spatial map of MOL1 (cyan), MOL2/3(magenta), and MOL5/6 (orange) OLs across the PPC and WM at P140, four days, and seven weeks post-cuprizone removal (4 d.p.c., 7 w.p.c.) ~50% of the OLs did not express any of the markers (None, gray). c) Healthy OL growth curves plotted by sub-region across the cortical and subcortical depth. d) Layer-specific differences in healthy oligodendrogenesis (p=0.012). e) Layer-specific differences in the percentage of OLs expressing Egr1 (p=0.0004, L1–3 vs. CC; p=0.006, L4 vs. CC). f) Layer-specific differences in the percentage of OLs expressing Klk6 (p=0.0034, L4 vs. L5–6; p=0.0034, L1–3 vs. L5–6; p=0.0009, L4 vs. CC; p=0.0009, L5–6 vs. CC). g) Layer-specific differences in the percentage of OLs expressing Ptgds (p=0.042, L5–6 vs. CC; p=0.005, L4 vs. CC; p=0.0005, L1–3 vs. CC). h) OL loss curves plotted by subregion across the cortical and subcortical depth. i) No layer-specific differences in cuprizone loss rate. Note increased variability of demyelination in L1–4. j) Layer-specific differences in MOL1 at 4 d.p.c. (p=0.016). k) Layer-specific differences in MOL2/3 at 4 d.p.c. (p=0.022, L5–6 vs. CC; p=0.004, L4 vs. CC; p=0.004, L1–3 vs. CC). l) No layer-specific differences for MOL5/6 at 4 d.p.c.. m) OL replacement curves plotted by sub-region. n) OL replacement is decreased specifically in L5–6 vs. CC (p=0.035). o) Layer-specific differences in MOL1 at 7 w.p.c. (p=0.012). p) Layer-specific differences in MOL2/3 at 7 w.p.c. (p=0.025, L1–3 vs. L5–6; p=0.025, L4 vs. L5–6; p=0.003, L1–3 vs. CC; p=0.003, L4 vs. CC). q) Layer-specific differences in MOL5/6 at 7 w.p.c. (p=0.015). Data in c,d,h,I,m,n represent n=6 mice per group, data in e-g n=8 mice, 2 sections per mouse, data in j-l n=5 mice, 2 sections per mouse, o-q n=7 mice, 2 sections per mouse. *p<0.05, **p<0.01, ***p<0.001, n.s., not significant. For growth curves, cubic splines approximate the measure of center and error bars are 95% confidence intervals, box plots represent the median, interquartile ranges and minimum/maximum values. Statistical tests were One-way ANOVA with Tukey’s HSD (d, e, g, n, o, q) or Kruskal-Wallis with Dunn’s test for multiple comparisons (f, j, k, p). For detailed statistics, see Supplementary Table 3.
