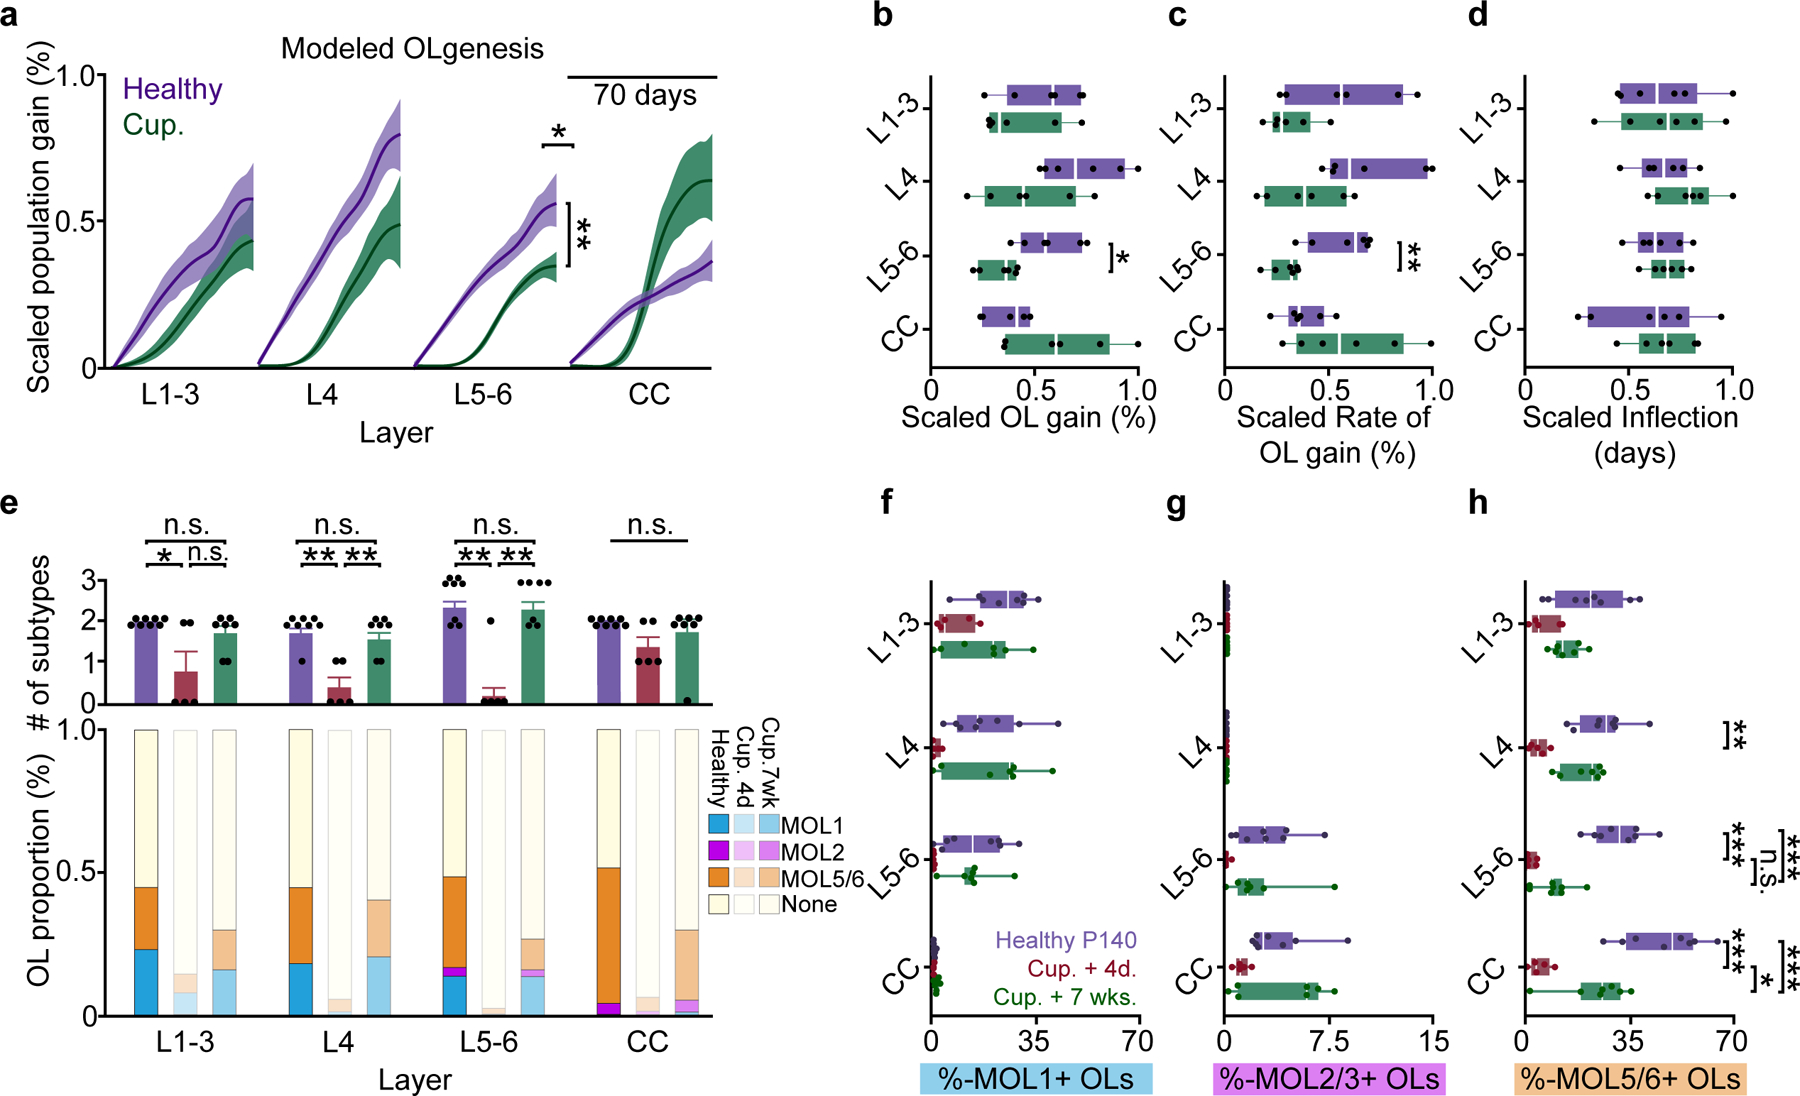
Figure 8 |. Decreased oligodendrogenesis and recovery of molecular identity in deep layers 5–6.

a) Modeled growth curves plotted by cortical sub-region and scaled to the maximum % gain or replacement to enable comparisons of healthy vs. regenerative oligodendrogenesis. Significance asterisks are related to data in (b–c). b) Decrease in scaled oligodendrogenesis in L5–6 post-cuprizone vs. healthy baseline, p=0.006). c) Decrease in scaled oligodendrogenesis rate in L5/6 after cuprizone (p=0.0025) d) No differences in scaled inflection points across regions. e) (Top) Differences in the number of molecular subpopulations represented at Healthy P140, Cup. +4d. and Cup. +7wk.time points (Bottom) Stacked bar chart showing changes in the relative proportion of MOL1, MOL2/3 and MOL5/6 OLs at 7-weeks post-cuprizone treatment. f) No differences in the MOL1-positive OL proportions within individual cortical layers across experimental time points. g) No differences in the MOL2/3-positive proportions within individual cortical layers across experimental time points. h) Differences in the MOL5/6 proportions within cortical layers across experimental time points (Healthy P140 (purple) vs. Cup. +4 days (red); p=0.001, L4; p=0.0001, L5–6; p=0.0001, CC). The proportion of MOL5/6 OLs returned at 7 weeks post-cuprizone only in the CC (Cup.+4d (red) vs. Cup.+7w (green), p=0.012). The MOL5/6 OL proportion returned to Healthy P140 levels in layers 1–4 but remained relatively decreased in L5–6 and the CC (Healthy P140 (purple) vs. Cup.+7wks. (green), p=0.0007, L5–6; p=0.001, CC). Data in a-d represent n=6 mice per group, data in e-h represent n=8 mice, 2 sections per mouse (P140), n=5 mice, 2 sections per mouse (Cup.+4d.) and, n=7 mice, 2 sections per mouse (Cup.+7wks.).*p<0.05, **p<0.01,***p<0.001, n.s., not significant; For growth curves, cubic splines approximate the measure of center and error bars are 95% confidence intervals, box plots represent the median, interquartile ranges and minimum/maximum values, bar plots are mean±SEM. Statistical tests were Two-way ANOVA with Bonferroni correction (between-groups comparisons, a– d), Two-way ANOVA with Tukey’s HSD (all comparisons, f-h), and Kruskal-Wallis with Dunn’s test for joint ranks (e). For detailed statistics, see Supplementary Table 3.
