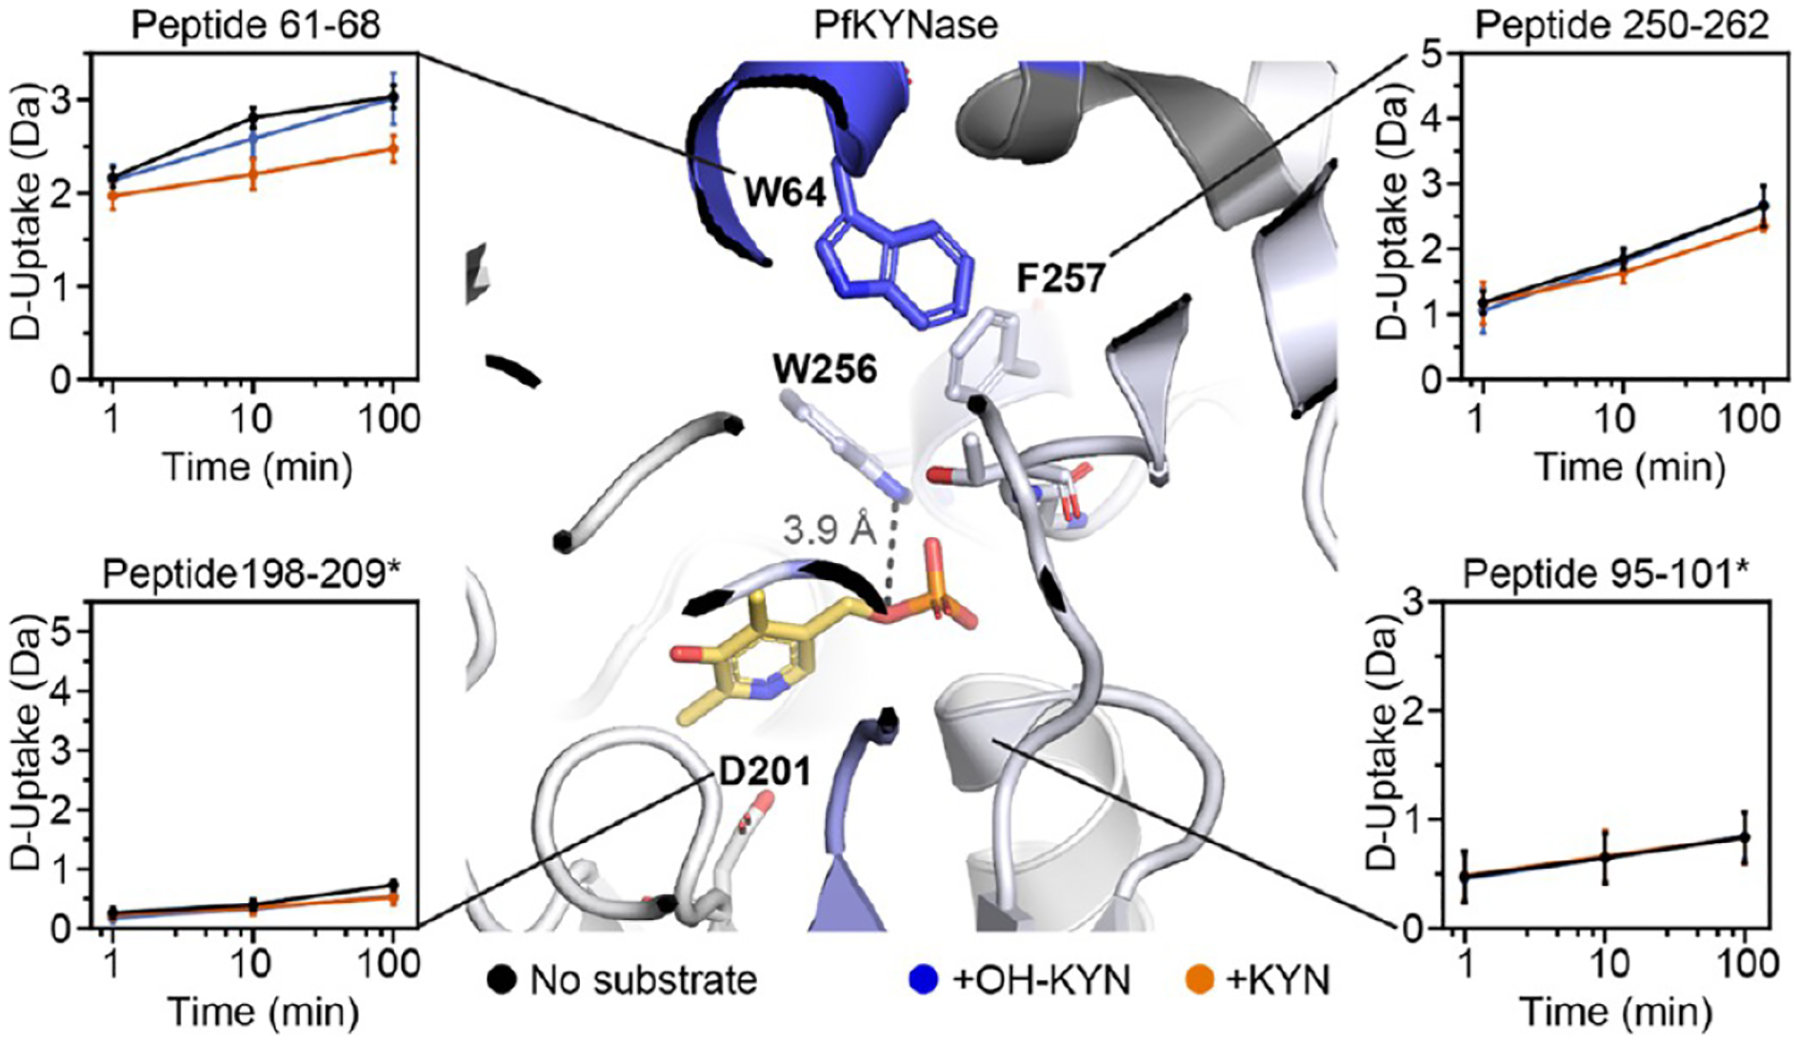
Figure 5.

The substrate binding site (but not the PLP pocket) of PfKYNase shows altered D uptake in the presence of substrates. D-uptake plot traces are no substrate (black), OH-KYN (blue), or KYN (orange). The y axis range is 50% of max D uptake assuming the N-terminal residue undergoes complete back-exchange. Data have not been corrected for back-exchange. * indicates that the region is contributed by the “second” KYNase chain. Error bars are ±2σ from three technical replicates. The structure is colored as in Figure 4A with W64, D201, W256, F257, G281, and T282 shown as sticks. Image shows distance between PLP and the W256 side chain (3.9 Å).
