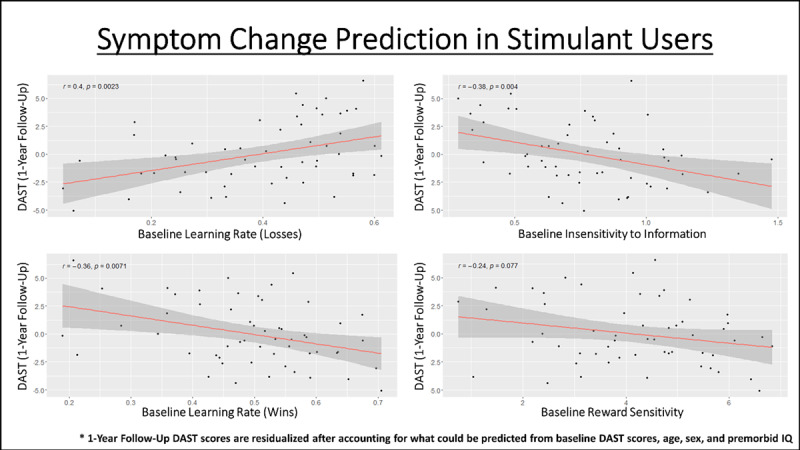
Figure 5.

Predictive relationships in stimulant users (full sample) between baseline model parameters and symptom severity at 1-year follow-up, after accounting for what could already be predicted based on age, sex, and premorbid IQ. The p-values shown here are uncorrected, but the relationships with learning rates and insensitivity to information survive correction for 6 comparisons (i.e., one per SUD group tested; corrected threshold of p < .0083). No relationship survives a more conservative correction for 30 comparisons (i.e., accounting for 5 parameters tested in each SUD group; corrected threshold of p < .0017).
