
Fig. 2.
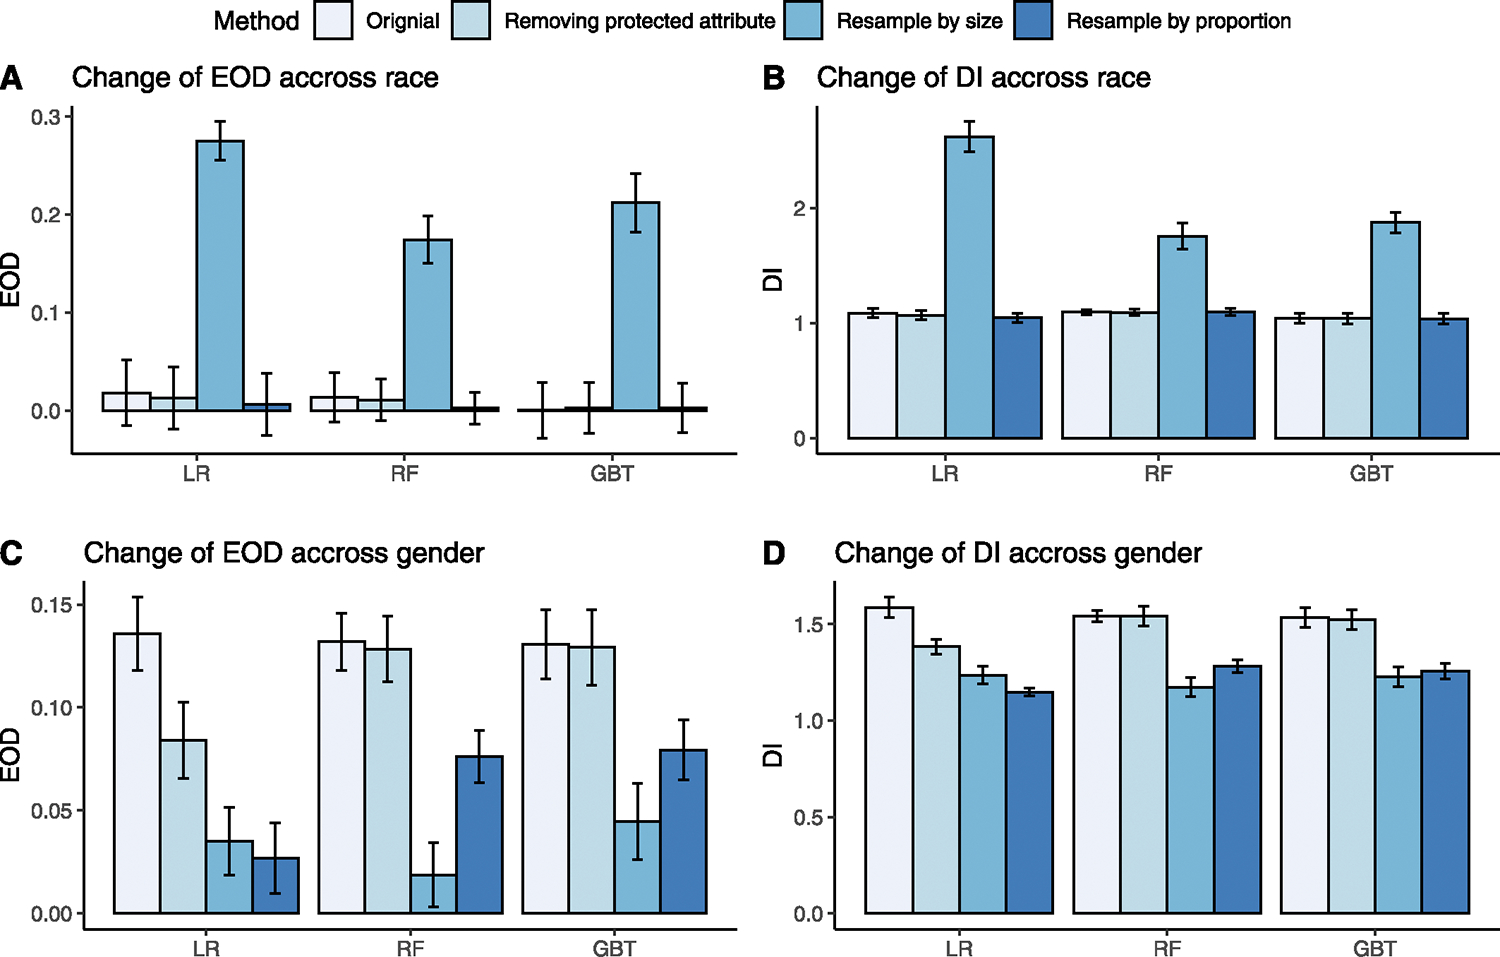
A comparison of EODs and DIs for three ML models before and after debiasing. The error bar represents standard deviation. A: Change of EOD across race groups before (original) and after removing protected attribute, resampling by size, and resampling by proportion compared to the original value before debiasing for each model. B: Change of DI across races before and after debiasing. C: Change of EOD across gender before and after debiasing. D: Change of DI across gender before and after debiasing.