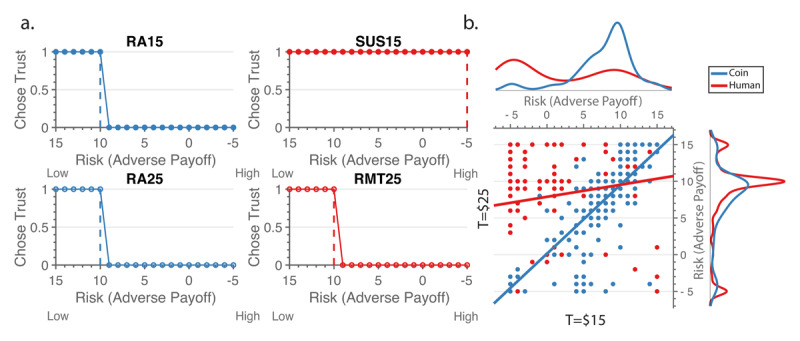
Figure 4.

From individual choices to thresholds. a. Example individual results for behavior, showing Heaviside threshold (dotted vertical line) determined for condition. The y-axis is a binary choice between trusting (1) and not trusting (0). The x-axis shows the adverse payoff in reverse order, such that lower thresholds (further to the right) indicate increased risk. b. Scatter plot of Sample 1’s thresholds comparing across the low and high temptation T values for coin conditions (blue) and partner conditions (red). Beside each axis, histograms show the relative count for each condition. The change in temptation had little impact on individuals’ thresholds when the second mover was a coin but did when it was a human.
