
Fig. 3.
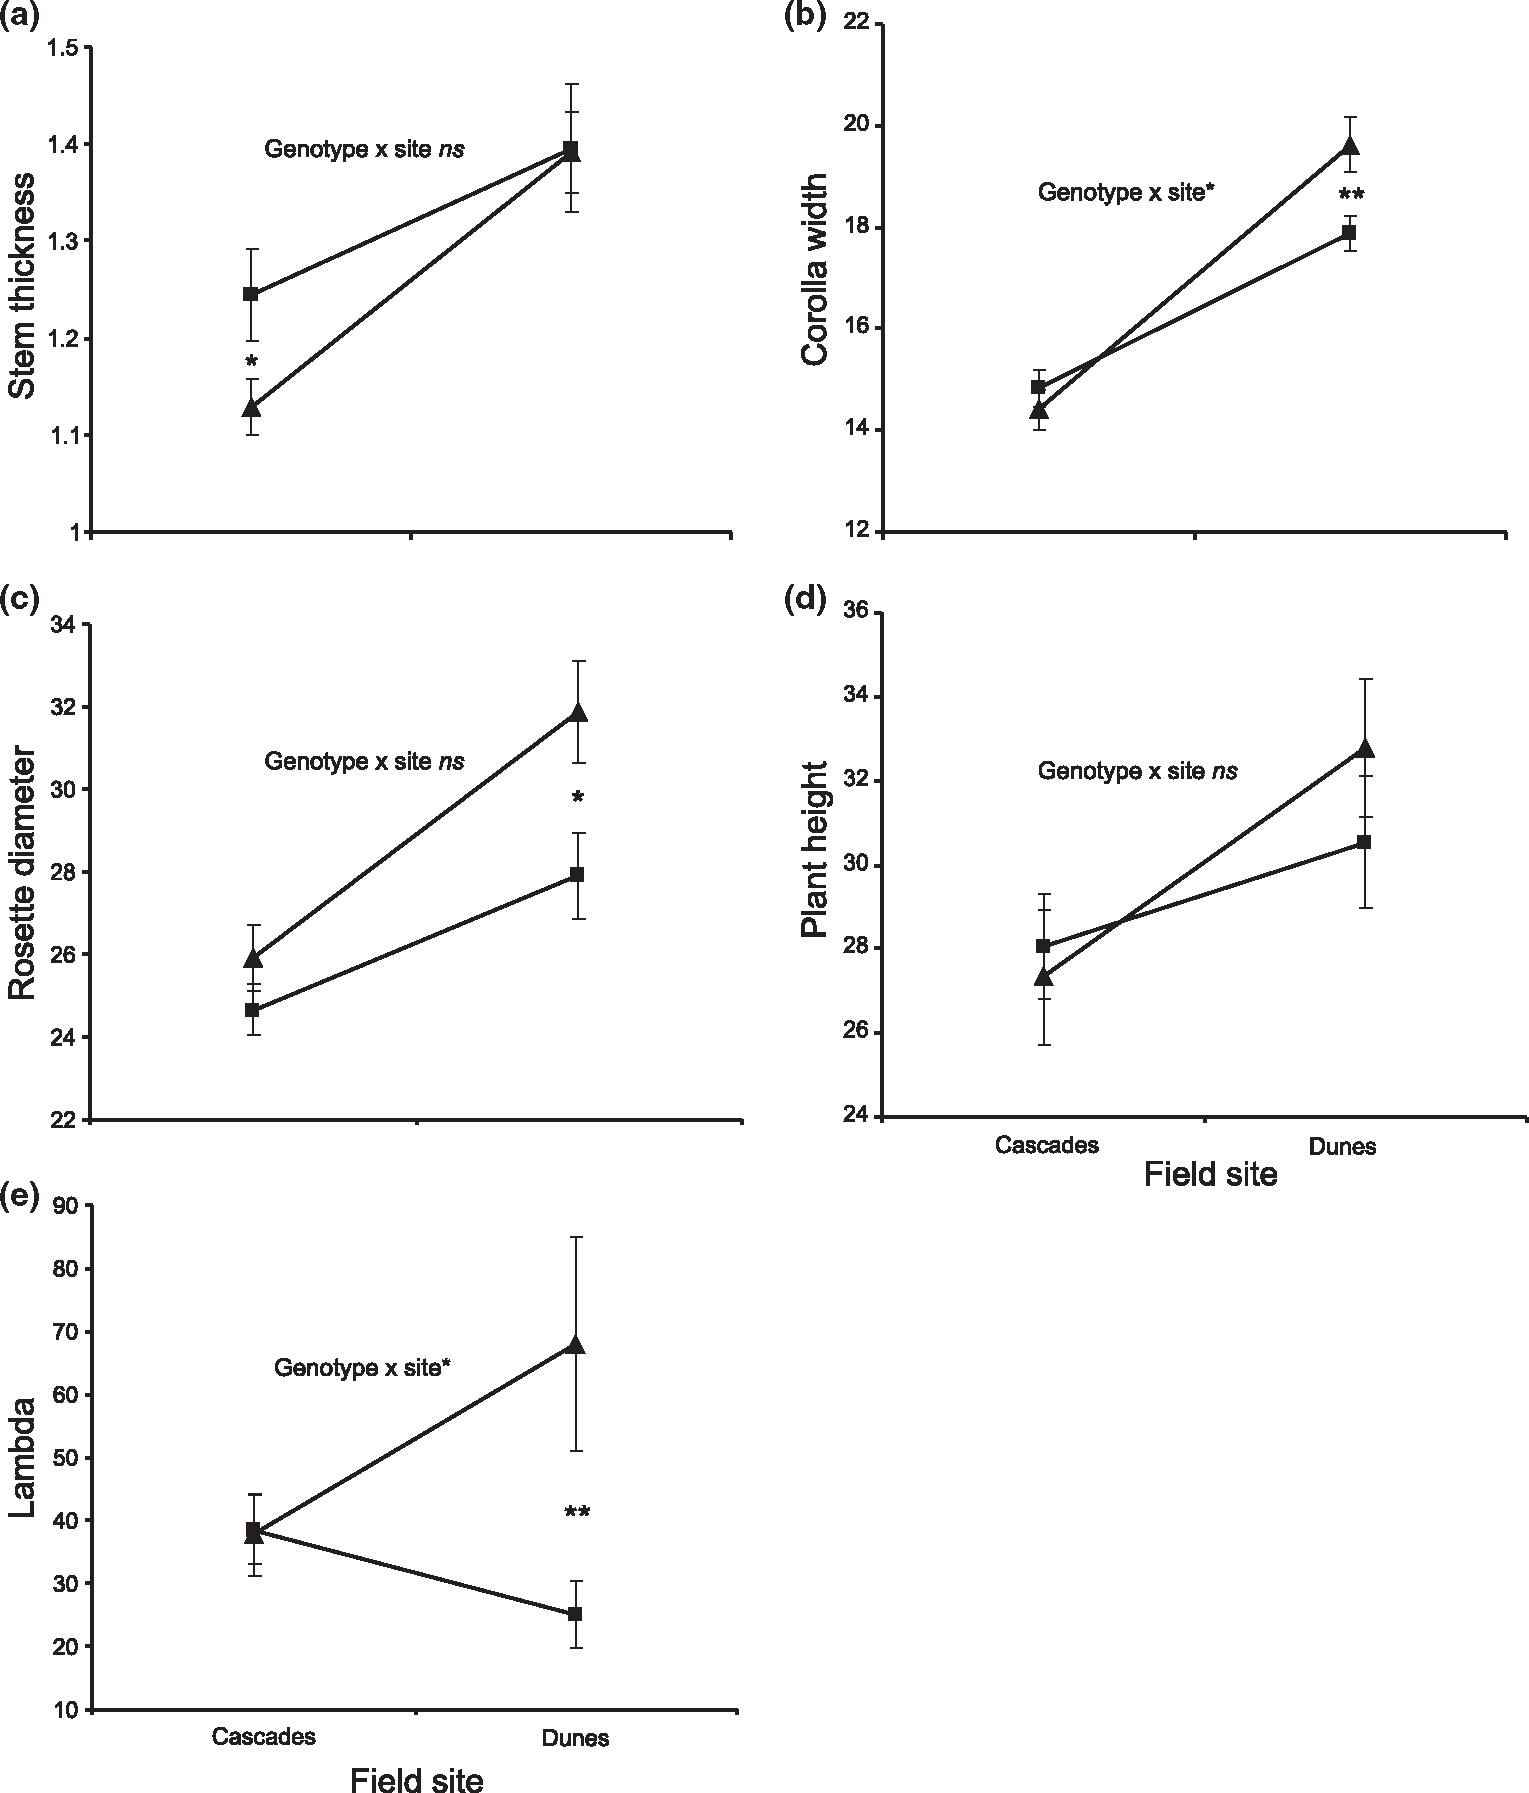
Mean (±SE) trait values for different genotypes measured in the two field environments for BC-IM lines at candidate markers DIV1 and DIV2 linked to the significant QTL peak detected in MCIM analysis. DIV1 and DIV2 represent the composite genetic effect all of linked loci spanning these QTLs. All size traits are in mm. Allelic effect of markers: (a) DIV1, (b–e) DIV2. Significant genotype × site interactions based on ANOVA (Table 5) at above markers are indicated. ns = not significant, *P < 0.05, **P < 0.01, ***P < 0.001. Differences between genotypes at a single site were tested using t-tests and only significant results (as indicated by P values) are shown. Significant t-test results for: (a) stem thickness at the Cascades site (DIV1), t103 = 2.20 (P = 0.030); (b) corolla width at the Dunes site (DIV2), t141 = −2.88 (P = 0.0046); (c) rosette diameter at the Dunes site (DIV2), t161 = −2.37 (P = 0.0188); e) lambda at the Dunes site (DIV2), t163 = −2.95 (P = 0.0036). ■ = IM/IM homozygotes, ▲ = IM/DUN heterozygotes.