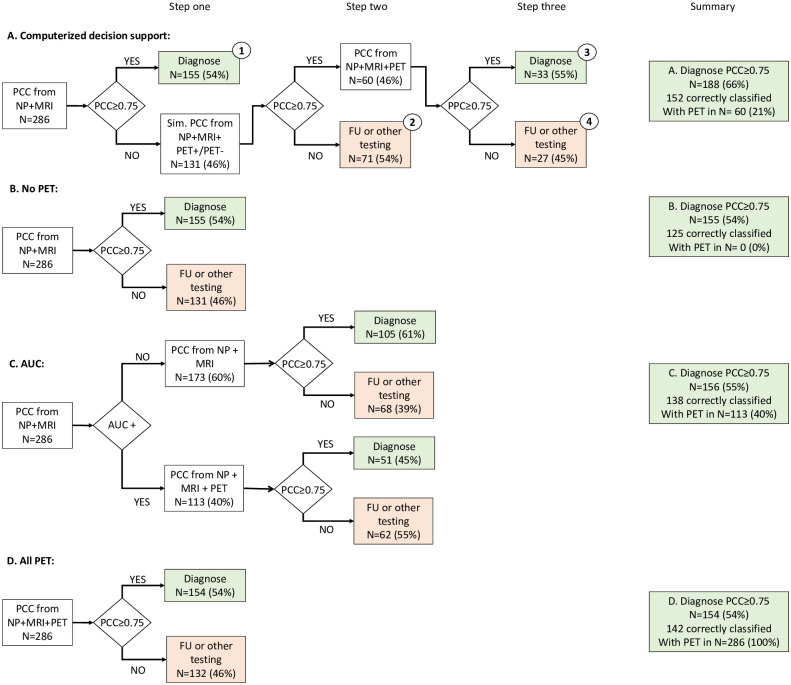
Fig 1. Flow chart for the four diagnostic approaches, using amyloid-PET visual read, summarizing the results in the last column.
AUC: appropriate use criteria, AUC+: patients fulfilling appropriate use criteria according to [13], operationalized as described in [14], PCC: probability of correct class, NP: neuropsychology, MRI: magnetic resonance imaging, Sim: simulate, FU: follow-up. Numbers in circles denote groups described in Table 2.

