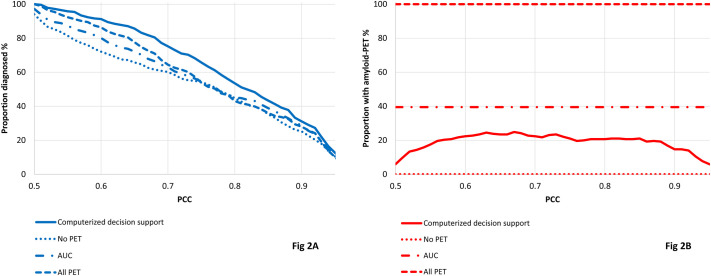
Fig 2. Visualization of the share of patients diagnosed (blue, 2A) and the share of patients with amyloid-PET performed (red, 2B) for different probability of correct class cutoffs, comparing computerized decision support, no amyloid-PET, AUC, and amyloid-PET for all patients.
Blue: proportion of patients diagnosed, Red: proportion of patients with amyloid-PET taken, PCC: probability of correct class. Solid lines show results for the computerized decision support (Fig 1A), dotted lines show results for using no amyloid-PET, but only demographics, APOE, neuropsychology and MRI (Fig 1B), dashed dotted lines show results for AUC (Fig 1C) and dashed lines using all data (Fig 1D).

