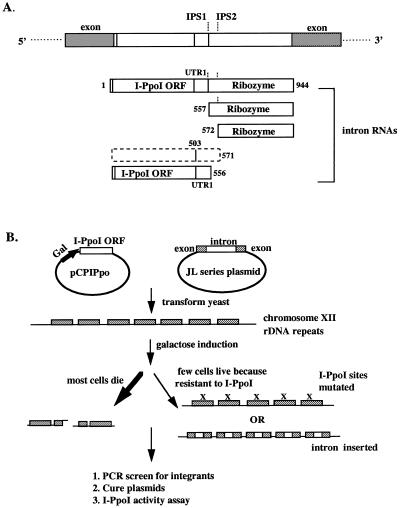
Figure 1.
The trans-integration method. (A) Schematic drawing of a yeast 25S rDNA gene with PpLSU3 inserted in position 1925 (E.coli reference sequence). Exon sequences are indicated by filled boxes, and intron sequences are indicated by open boxes. IPS1, internal processing site observed in vitro and in P.polycephalum; IPS2, internal processing site observed in yeast only. The numbers indicate the nucleotides from the beginning of the intron. The I-PpoI ORF extends from nucleotides 14 to 503. The unstable 5′ intron RNA fragment is shown by dashed lines. (B) Schematic diagram of the trans-integration method. Mutations at I-PpoI target sites are indicated by an X over the rDNA repeats.

