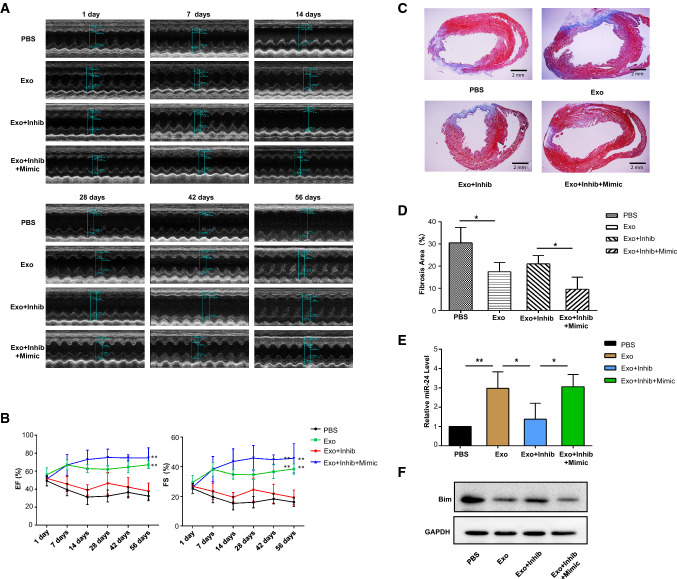
Fig. 7.
Rat myocardial function after MI induction and different exosome treatments. a Representative echocardiographic images from rats treated with PBS, Exo, Exo + Inhib, or Exo + Inhib + Mimic. b EF and FS preoperatively and at 1, 7, 14, 28, 42 and 56 days after MI induction (n = 4/group; **p < 0.01). c Masson’s trichrome staining in heart sections 56 days after ligation of the left anterior descending (LAD) artery (scale bars, 2 mm). d Percentage of infarct zone in heart sections (n = 4; *p < 0.02). e Real-time PCR analysis of the relative expression of miR-24 in the infarct zone with different exosome treatment 3 days after LAD ligation (n = 4, *p < 0.02, **p < 0.01). f Western blots of Bim expression in the infarcted zone

