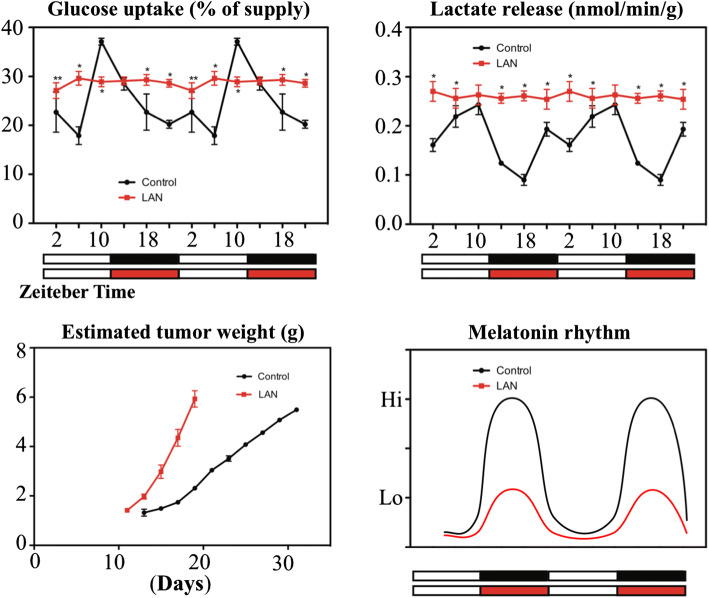
Fig. 1.
The top two panels summarize the circadian changes, or lack thereof, in glucose uptake (left) and lactate release (right) under two different lighting conditions. When tumor-bearing rats were exposed to light:dark cycle where it was dark at night (alternating white and black bars at the bottom), both the uptake of glucose and the release of lactate (black curves in panels) exhibited strong circadian rhythms with highest levels of each parameter occurring during the day, indicating that they were using cytosolic glucose oxidation to produce ATP, when circulating endogenous melatonin are lowest (black curve, right lower panel). Conversely, when tumors were collected from animals kept under a light:dark cycle where rats were exposed to dim light at night (LAN) (alternating white and red curves), both glucose and lactate remained elevated throughout the 24-h period; this indicated that the tumors were using cytosolic glucose oxidation to produce ATP. LAN was associated with a markedly diminished nocturnal melatonin increase (red curve, lower right panel). The data are double plotted for clarity. A similar rhythm was seen in 3H-thymidine uptake by the tumors (an index of DNA synthesis and cell proliferation) (data not shown). The lower left panel summarizes the growth of the tumors under the two lighting conditions. The figure was drawn and restructured from the data of Blask et al. [29]

