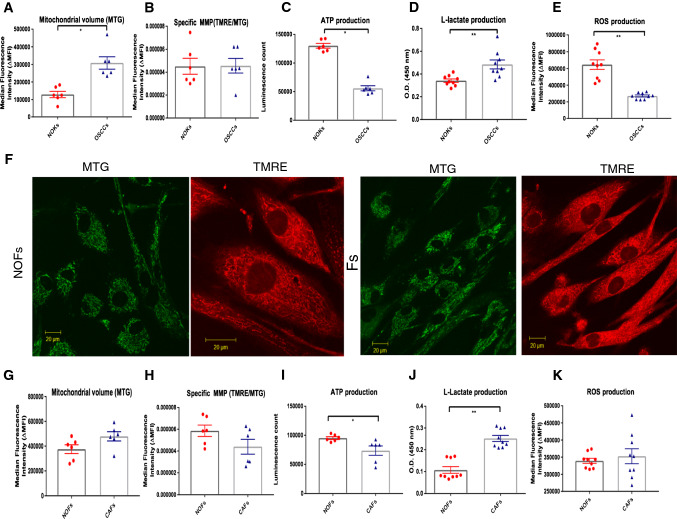
Fig. 2.
Comparison of mitochondrial volume, MMP, ATP, l-lactate and ROS generation between NOKs and OSCCs AND between NOFs and CAFs. a, b Flow cytometric analysis of NOKs and OSCCs for their mitochondrial volume (b) and specific MMP (c). Although there was increased level of mitochondrial volume detected in OSCCs compared to NOKs, the specific MMP displayed the same level. c Measurement of the intracellular ATP showed statistical significant higher levels in NOKs compared to OSCCs. d, e Measurement of l-lactate production and ROS activity showed increased l-lactate and less ROS levels in OSCCs compared to NOKs. f Representative images of mitochondrial morphology stained with MTG and TMRE in NOFs and CAFs (magnification × 40, scale bar = 20 μm). Flow cytometric analysis of NOFs and CAFs for their mitochondrial volume (g) and specific MMP (h) showed increased mitochondrial volume and less specific MMP in CAFs compared to NOFs. i Measurement of intracellular ATP production showed significantly higher production in NOFs than in CAFs. j, k Measurement of l-lactate and ROS activity shows slightly higher levels of both in CAFs than in NOFs. The data points were presented from six different patient sets. All points represent mean values and SEM. Independent experiments were performed more than three times. *p < 0.05, **p < 0.01; Wilcoxon signed-rank test was used

