Fig. 3.
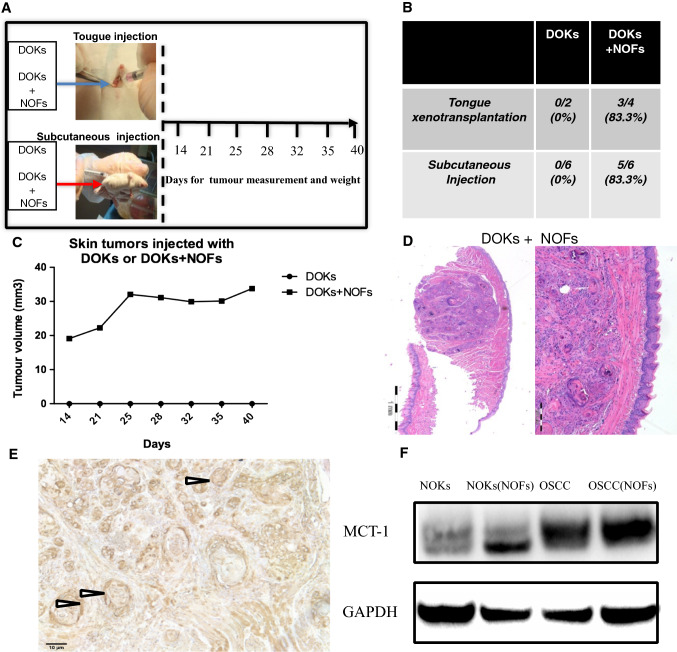
Tumor formation by DOKs xenotransplated alone or with NOFs. a Flowchart for tongue and skin xenotransplantation in NOD/SCID IL2rγ (null) mice of DOK cells with and without NOFs. Tumor formation and measurement were checked once a week from day 14 until day 40. b Quantification of the incidence of tumors induced by xenotransplantation of DOK alone or with NOFs, showing that DOKs can only generate tumors in combination with NOFs. c Growth rates of subcutaneous tumors induced by DOKs xenotransplanted alone and with NOFs. d H&E staining of representative tongue tumors harvested at day 42 after orthotopic tongue injections with 103 DOKs with 105 NOFs, showing well differentiated squamous cell carcinoma lesions with typical keratin pearl formation. e Representative image of an immunohistochemically stained a tongue tumor showing strong expression of MCT-1 by epithelial cancer islands (like the island pointed by the arrow). Scale bar = 10 μm

