Fig. 5.
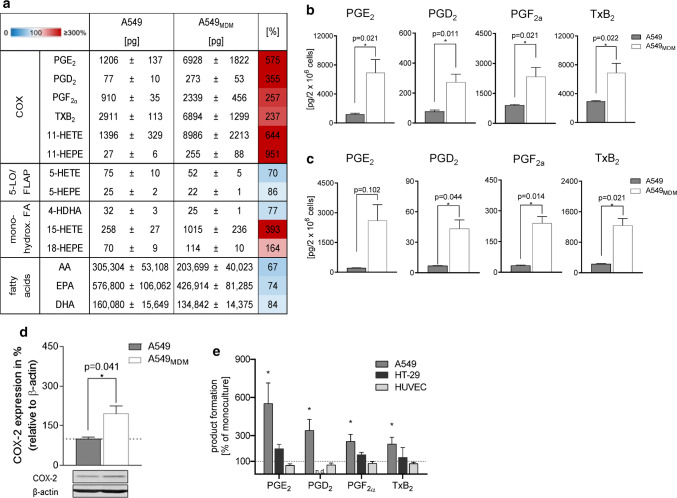
Coculture of A549 cells with MDM increases COX-2 expression and prostanoid formation. A549 cells were cocultured with MDM or kept in monocultures in a Boyden chamber (see Fig. 1a) for 48 h in the presence of IL-4. a, b A549 cells were separated from MDM and challenged with E. coli (O6:K2:H1; ratio = 1:50) for 90 min at 37 °C. Then LM were extracted and analyzed by UPLC-MS–MS. a Data for all detectable LM are given as absolute amounts (pg/2 × 106 A549 cells, means ± S.E.M., n = 4) and as percentage of A549 cocultures with MDM versus A549 monocultures (= 100%), shown in a heatmap. b Absolute amounts (pg/2 × 106 MDM) of PG shown as bar charts. Data are means ± S.E.M., n = 4. *P < 0.05, two-tailed t test. c A549 cells were separated from MDM and challenged with 0.5 µM Ca2+-ionophore A23187 for 10 min at 37 °C. Then LM were extracted and analyzed by UPLC-MS–MS. Data are given as pg/2 × 106 A549 cells, means ± S.E.M., n = 3. d A549 cells were separated and analyzed for protein expression of COX-2 by Western blot, normalized to β-actin. Western blots are shown as representatives and data are given as means ± S.E.M., n = 6–10 separate donors; *P < 0.05, monocultures (100%) versus cocultures, two-tailed t test. e A549 cells, HT-29 cells or HUVEC were cocultured with MDM or kept in monocultures, each, in the Boyden chamber (see Fig. 1a) for 48 h in the presence of IL-4. A549 cells, HT-29 cells or HUVEC were separated from MDM and challenged with E. coli (O6:K2:H1; ratio = 1:50) for 90 min at 37 °C. Then PG were extracted and analyzed by UPLC-MS–MS. Changes in PG formation in A549 cells, HT-29 cells or HUVEC after precedent coculture with MDM, given in percentage versus LM produced in monocultures (= 100%), upon subsequent exposure to E. coli. Data are means ± S.E.M., n = 3–4 separate donors; *P < 0.05, two-tailed t test

