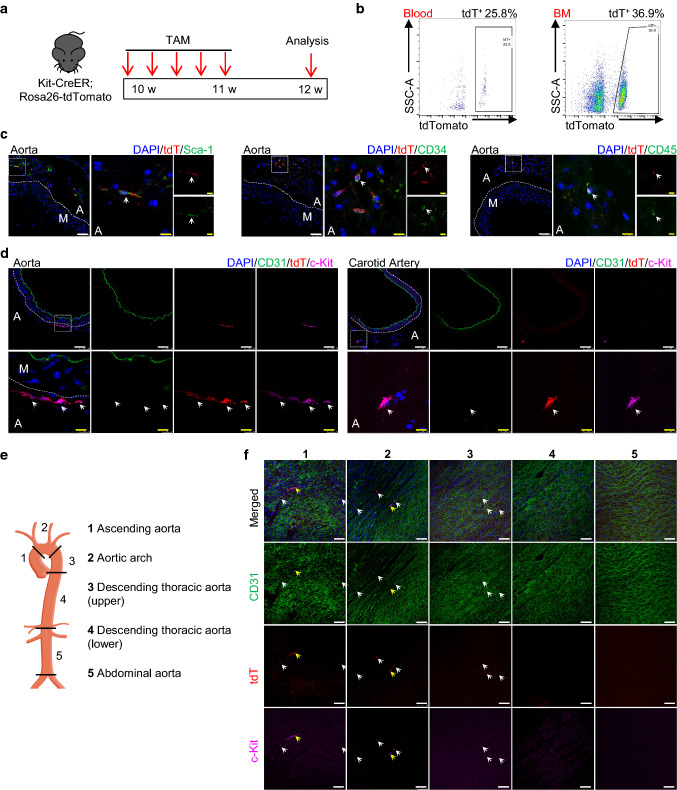
Fig. 2.
Lineage tracing showing the distribution of tdTomato-labelled c-Kit+ cells in the blood vessels. a Schematic showing tamoxifen-induced tdTomato labelling of c-Kit+ cells using Kit-CreER; Rosa26-tdTomato mice (n = 6). Mice were treated with tamoxifen for 1 week, and aortas were harvested and analyzed 1 week later. b Representative flow cytometric analysis of tdTomato+ cells in the blood and bone marrow. c Representative images showing staining of tdTomato, Sca-1, CD34, and CD45 in tamoxifen-treated mice. Arrows indicate examples of co-staining cells. d Representative immunostaining of cross sections showing the expression of CD31, tdTomato, and c-Kit in the aorta and carotid artery. Arrows indicate examples of tdT+c-Kit+ cells. e Aorta was divided into five segments for further analysis and numbered as follows: 1, ascending aorta; 2, aortic arch; 3, descending thoracic aorta (upper); 4, descending thoracic aorta (lower); 5, abdominal aorta. f Representative en face staining of aortic intimal layers from different segments showing expression of tdTomato, CD31, and c-Kit. Arrows indicate examples of tdT+c-Kit+ cells. Scale bars, 50 μm (white) and 10 μm (yellow). TAM, tamoxifen; BM, bone marrow; A, adventitia; M, media; tdT, tdTomato

