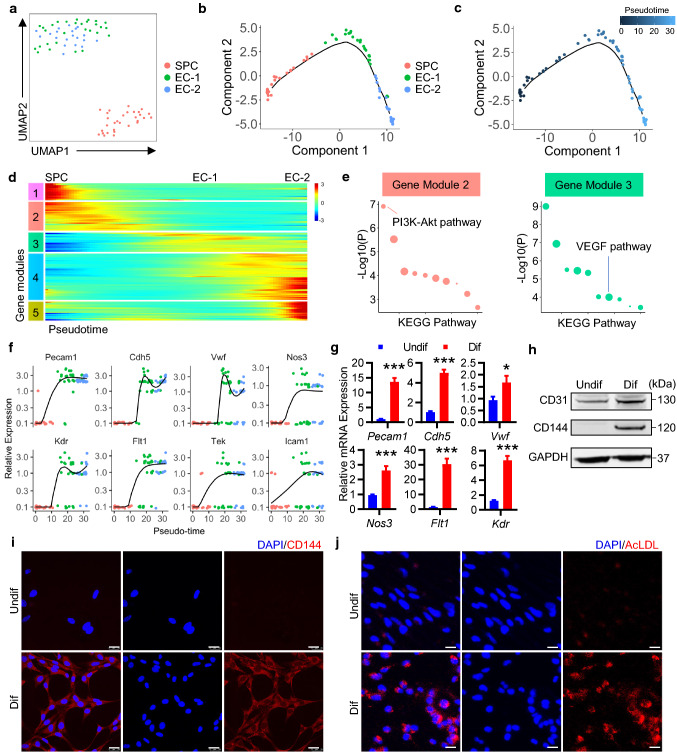
Fig. 6.
c-Kit+ SPCs differentiate into ECs. a UMAP plot showing color-coded nonimmune cell clusters from scRNA-seq analysis of tdTomato+ cells pooled from aortic grafts by high-resolution clustering. n = 79 cells. b, c Pseudotime trajectory analysis of tdTomato+ nonimmune cells (SPC and ECs). Cells are color-coded by cell clusters (b) or pseudotime (c). d Heatmap performed on pseudotime showing expression of gene modules (differentially expressed genes) in all cell clusters. e Gene set enrichment analysis of KEGG pathway in gene module 2 and 3. Dot size indicates proportional to the fold enrichment. f Kinetics plots showing expression of selected EC marker genes over pseudotime. g–j, Isolated vascular c-Kit+ SPCs were cultured in EGM2 medium for 3 days to induce cell differentiation. g Quantitative PCR analyses showing relative gene expression of EC markers normalized to Gapdh (n = 10 per group). h Representative western blot showing expression of endothelial marker CD31 and CD144 (n = 5). i Representative images showing staining of CD144 in undifferentiated and differentiated c-Kit+ SPCs (n = 3). j Representative images showing uptake of AcLDL in undifferentiated and differentiated cells (n = 3). Scale bars, 25 μm (i, j). Data represent mean ± SEM, *P < 0.05, ***P < 0.001, unpaired two-tailed t test (g). Undif, undifferentiated cells; Dif, differentiated cells; AcLDL, acetylated low-density lipoprotein

