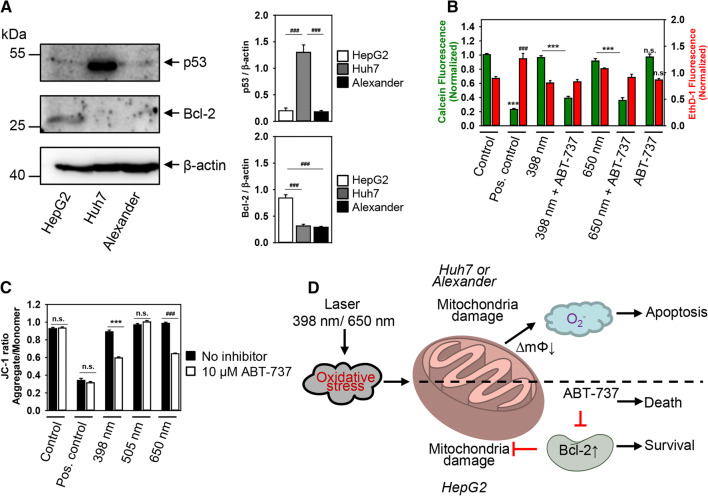
Fig. 8.
Inhibition of Bcl-2 sensitizes HepG2 to HFLP laser-induced death. a Bcl-2 and p53 were analyzed in whole cell lysates of HepG2, Huh7 and Alexander cells by immunoblotting; β-actin—control of equal protein loading. The graphs show densitometric quantification of p53 and Bcl-2 immunoblots. Data are expressed as mean ± SEM (n = 3), ###p < 0.001. b HepG2 cells were labeled with calcein AM (green) and ethidium homodimer (red). Labeled cells were exposed to HFLP laser (398 and 650 nm; 50 µW) in the presence or absence of ABT-737 (10 µM) for 1 h. Control cells were untreated. As a positive control, cells were treated with 20% ethanol for 30 min. ImageJ software (NIH) was used for image processing and quantification. Fluorescence intensity of both dyes was measured and was normalized to total fluorescence of non-irradiated spot. Data are expressed as mean ± SEM (n = 3), ***p < 0.001, ###p < 0.001. c HepG2 cells were labeled with 1 μM JC-1. Labeled cells were exposed to HFLP laser (398, 505 and 650 nm nm; 50 µW) in the presence or absence of ABT-737 (10 µM) for 30 min. Quantitative analysis of ΔmΦ imaged by laser scanning confocal microscopy was performed utilizing LaserSharp 2000 software (BioRad). Data are expressed as mean ± SEM (n = 3), ***p < 0.001, ###p < 0.001. As a positive control, cells were treated with 20% ethanol. d Scheme of redox signaling activation in distinct cell lines after stimulation with different laser wavelengths. ∆mΦ—mitochondrial membrane potential

