Fig. 2.
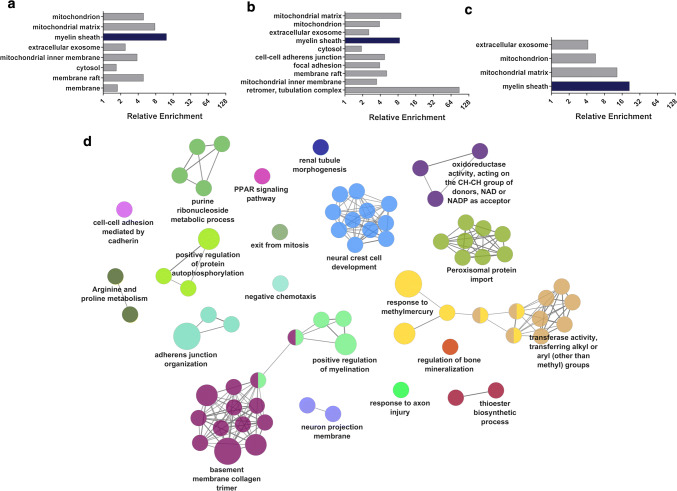
Proteomic analysis of DFT1 and DFT2 cell lines. Protein expression was analysed in triplicate samples of DFT1, DFT2 and fibroblast cell lines by high throughput proteomic mass spectrometry. Proteins expressed at least twofold higher in DFT1 or DFT2 cell lines relative to fibroblasts were selected for functional enrichment analysis. a–c Plots represent cellular component GO terms associated with proteins highly expressed relative to fibroblasts in a DFT1 cells, b DFT2 cells and c both DFT1 and DFT2 cells, as determined by enrichment analysis using the proteomic database DAVID. Fold enrichment of up to ten terms significantly associated with each gene set is shown (p < 0.01). The Schwann cell associated term ‘myelin sheath’ is highlighted in each graph in dark blue. d The top 100 most highly expressed genes in DFT2 cells lines relative to fibroblasts were analysed by ClueGO. Enriched GO terms, KEGG pathways and REACTOME pathways were clustered into functionally-associated groups (shown as different colours) by shared genes (kappa score > 0.4). Each group is labelled by the most significant term in the group. The size of each node represents it’s significance

