Fig. 3.
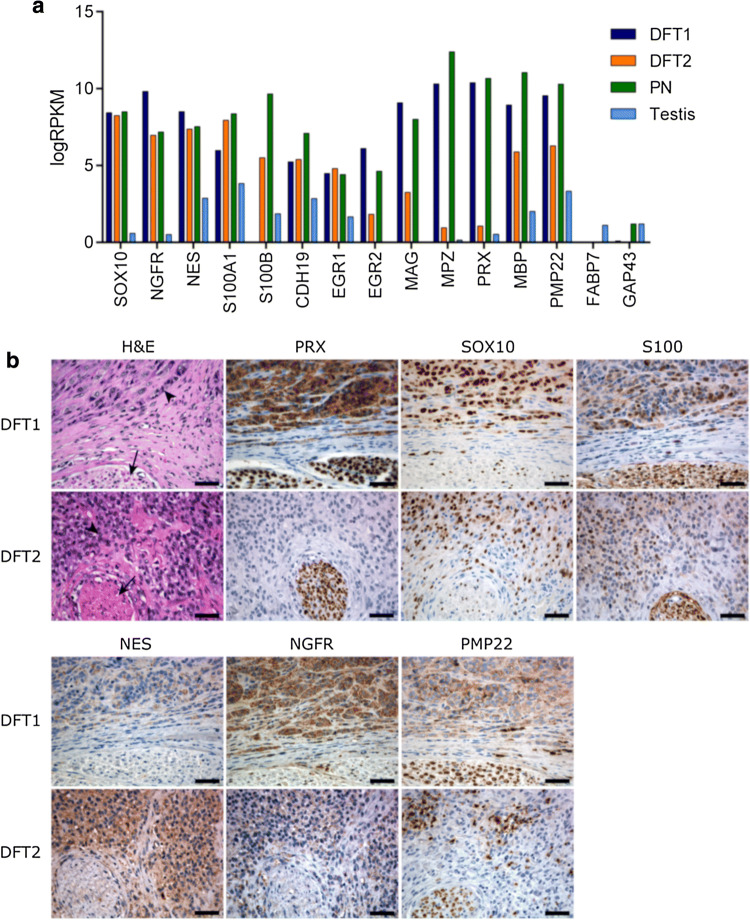
Analysis of Schwann cell marker expression in DFT1 and DFT2 tumours. a Gene expression was analysed in peripheral nerve (PN), DFT1 and DFT2 tumour samples and testis by RNA sequencing. Average RPKM-normalised read counts of Schwann cell lineage markers and myelination markers were plotted for each tissue. b Representative tissue sections from DFT1 and DFT2 tumours were stained with H&E or antibodies against the Schwann cell markers PRX, SOX10, S100 (multiple gene isoforms), NES, NGFR and PMP22. Serial sections were chosen to include tumour cells (indicated by an arrowhead) and a peripheral nerve bundle (indicated by an arrow) as a Schwann cell enriched tissue. Scale bars represent 50 µm

