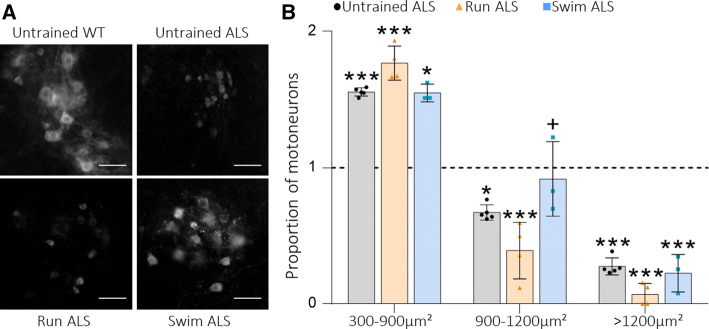
Fig. 5.
Motoneuron population proportions change depending on the training protocol. a Representative images of motoneurons identified with ChAT immunolabeling in the ventral horn of the lumbar spinal cord (scale bar: 50 μm). b Proportion of motoneuron populations in relation to the WT untrained group by soma area at P115. Data are mean ± S.D ***P < 0.001, **0.001 < P < 0.01, *0.01 < P < 0.05), *Versus Untrained WT mice; +versus Run ALS mice

