Fig. 4.
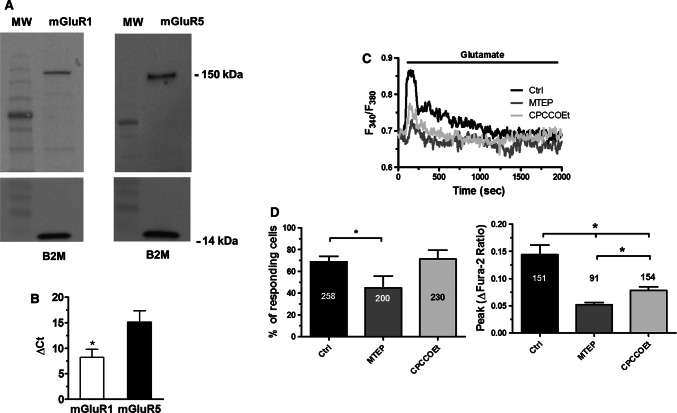
The Ca2+ response to glutamate is mediated by mGluR1 and mGluR5. a Expression of mGluR1 and mGluR5 proteins in hCMEC/D3 cells. Blots representative of four independent experiments were shown. Lanes were loaded with 30 µg of proteins, probed with affinity purified antibodies, and processed as described in “Materials and methods”. The same blots were stripped and re-probed with anti-beta-2-microglobulin (B2M) polyclonal antibody, as housekeeping. Major bands of the expected molecular weights were indicated. b Expression of mGluR1 and mGluR5 transcripts in hCMEC/D3 cells. Reverse transcription polymerase chain reaction of total RNA was performed using specific primers as indicated in Materials and methods. c Glutamate (100 μM) caused a rapid increase in [Ca2+]i which was reduced by CPCCOEt (100 µM, 10 min) and MTEP (100 µM, 10 min), which, respectively, block mGluR1 and mGluR5. d Left panel, bar histogram shows the mean ± SE of the percentage of responding cells in control conditions and upon treatment with MTEP (100 µM, 10 min) and CPCCOEt (100 µM, 10 min). Right panel, bar histogram shows the mean ± SE of the amplitude of the response under the designated treatments. The asterisk indicates that p < 0.05

