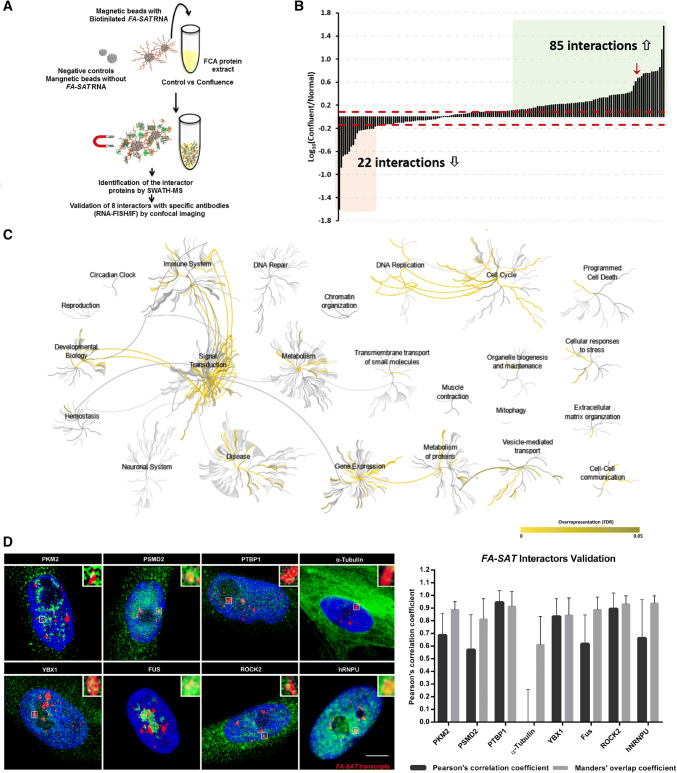
Fig. 3.
FA-SAT ncRNA protein interaction analysis. a Schematic representation of FA-SAT ncRNA pull-down experiments. b Interaction changes of the 163 FA-SAT RNA interactors under normal vs confluent conditions. The levels of the interactor co-purified under confluence were compared with the normal conditions and the fold changes are presented in log10 scale. The dashed red lines represent the minimum fold-change values for biological regulation in the present analysis (according with Supplementary Fig. 3). The interactors with changes > 1.223-fold increase are in green and changes > 0.730-fold decrease are in red. c Pathway enrichment analysis of the FA-SAT ncRNA interactors. The analysis was performed in Reactome using the 163 putative FA-SAT ncRNA interactors. In all cases, their known interactors (available in IntAct) were imported to include the entire network and increase the analysis background. Pathways were considered enriched for FDR analysis below 5%. d Representative images of the co-localization assay of FA-SAT ncRNA (red) with 8 protein (green) that resulted from projections of several plans (confocal image). A co-localization spot was amplified 350% (top, right). The DNA is in blue (DAPI). Scale bar represents 10 µm. Graphic of the validation of the co-localization of the 8 proteins’ antibodies with FA-SAT ncRNA. Each co-localization spot in each nucleus was analyzed by Pearson’s correlation coefficient and Manders’ overlap coefficient (a minimum of 25 co-localization spots or 15 cells were analyzed)

