Fig. 1.
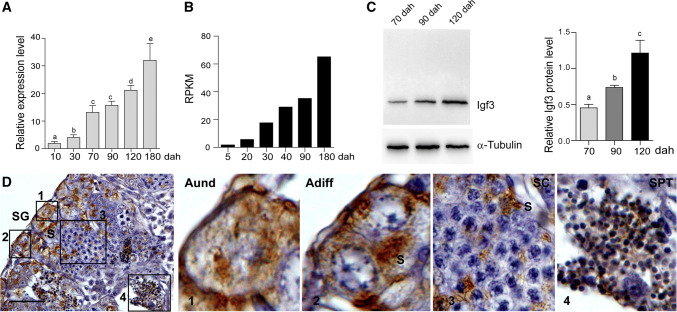
Expression pattern and cellular localization of Igf3 in tilapia testis. a Expression of igf3 mRNA in the tilapia XY gonads at different developmental stages, as determined by real-time PCR. Data are expressed as the mean ± SD of three different gonadal pools at each developmental stage. Different letters indicate statistical differences at p < 0.05 as determined by one-way ANOVA followed by Tukey’s/Kramer post hoc test. b Transcriptomic analysis shows that igf3 expression was up-regulated during gonadal development. XY gonads from tilapia at 5, 20, 30, 40, 90 and 180 dah were sequenced using Illumina 2000 HiSeq technology in our previous study. A normalized measure of RPKM (reads per kb per million reads) was used to normalize the expression profiles of igf3. c Expression of the Igf3 protein in testes at 70, 90 and 120 dah was determined by Western blot. α-Tubulin was used as a loading control. d Cellular localization of the Igf3 protein in tilapia testis at 180 dah, as determined by IHC. The positive signal is denoted by the brown color. 1, 2, 3 and 4 are magnifications of the boxed areas of d. Aund type A undifferentiated spermatogonia, Adiff type A differentiated spermatogonia, SG spermatogonia, SC spermatocyte, SPT spermatid, S Sertoli cells, dah days after hatching. Scale bar 25 μm

