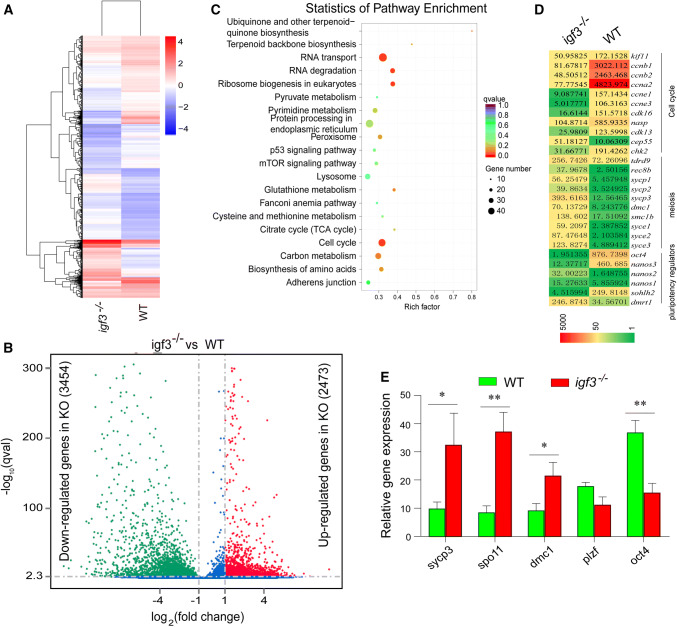
Fig. 4.
Genes and molecular pathways dysregulated in Igf3-deficient testes. a Heat map of the expression of 70 Foxm1-regulated genes that were up-regulated (red) or down-regulated (blue) by two fold or more (p ≤ 0.05) in testes from Igf3-deficient tilapia relative to their expression in WT testes; presented as signal intensity normalized to the median value of signal intensities of all samples. b Volcano plots were generated using a log2 fold-change against log10 (p value) displaying the abundance of differentially expressed genes (red and green dots) of igf3−/− vs. WT fish. Red and green dots represent up-regulated (2473) and down-regulated (3454) genes in igf3−/− testes, while the blue dots represent equally expressed genes between WT and igf3−/− testes. c KEGG enrichment analysis of DEGs. Scatterplot of enriched KEGG pathways for DEG screened from igf3−/− vs. WT fish. The enrichment factor indicates the ratio of the DEGs number to the total gene number in a certain pathway. The size and color of the dots represent the gene number and the range of p values, respectively. d Comparative transcriptomic analysis between igf3−/− and wild-type testes reveal a significant up-regulation of meiosis-related genes and down-regulation of regulators of meiosis, pluripotency and the cell cycle. e Real-time PCR results show that mRNA level of the meiosis related genes sycp3, dmc1 and spo11, were significantly up-regulated in the igf3−/− testis. Data are expressed as the mean ± SD of triplicates. Differences between groups were statistically examined with unpaired two tailed Student’s t test; *p < 0.05, **p < 0.01

