Fig. 1.
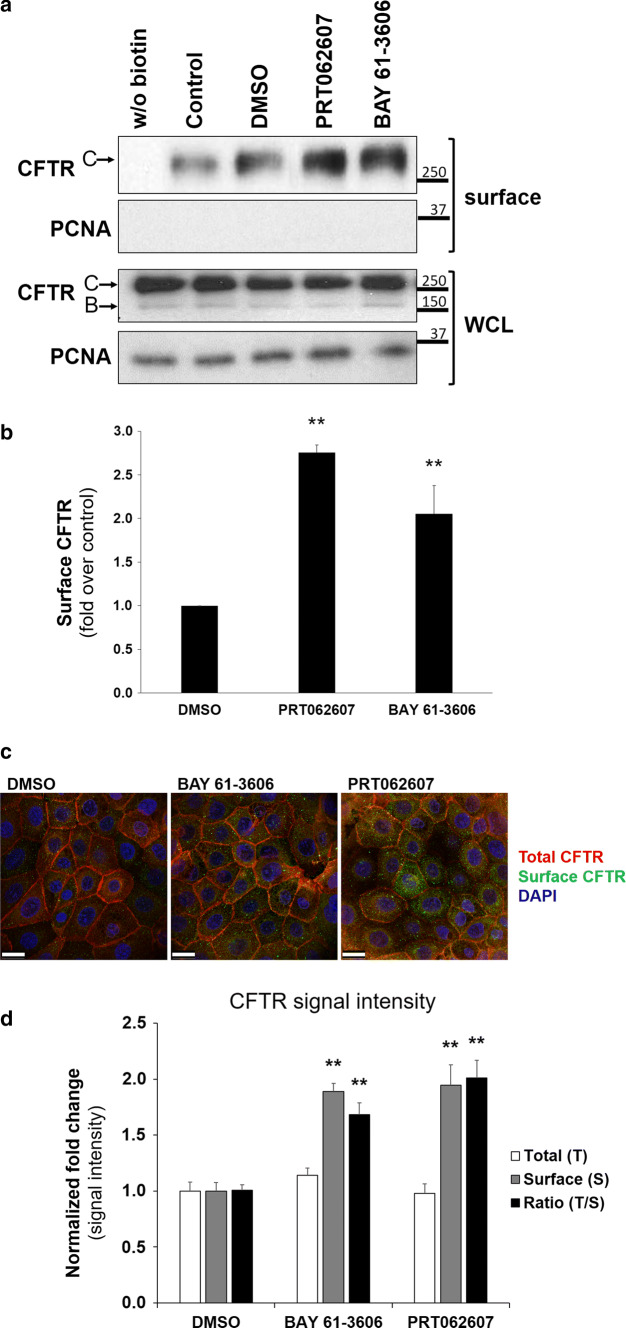
Effect of pharmacological SYK inhibition on the levels of CFTR at the PM of CFBE cells. CFBE wt-CFTR cells were treated for 1 h with control solvent DMSO, or with one of the SYK inhibitors BAY 61-3606 (8 nM) or PRT062607 (1 nM). After the treatment, cell surface proteins were biotinylated, cells lysed, and proteins resolved by SDS-PAGE and detected by WB. a Detection of the indicated proteins in whole-cell lysates (WCL) or in the biotinylated protein fraction (surface). For CFTR, the mature, fully glycosylated and the immature, core-glycosylated protein are marked as bands C and B, respectively. The PCNA protein served as a loading (WCL) and contamination (surface) control, respectively. b Corresponding quantification of CFTR detection in the biotinylated cell surface fractions, obtained from at least three independent experiments. Densitometric analyses of the band intensities in a were expressed relative to DMSO-treated cells. All shown data represent means ± SEM; **P < 0.01. c After inhibitor treatment, mCherry-Flag-wt-CFTR expressing CFBE cells were fixed and analyzed by confocal fluorescence microscopy. Confocal images captured the cell surface plane of non-permeabilized cells and show an overlay from triple-labeled cells, where mCherry fluorescence reflects the total amount of CFTR, Alexa Fluor 488 fluorescence stains the amount of Flag-CFTR present at the cell surface and DAPI stains nuclei. The cell surface plane was selected after acquisition of a 0.2-μm Z-stack of 1-Airy confocal images. Note that inhibitor treatment increased the green signal representing Flag-tagged CFTR at the cell surface. White bars correspond to 25 μm. d Corresponding quantification of total and cell-surface located CFTR signal intensities in the images. ImageJ software (NIH) was used to delimit each single cell as an individual region-of-interest to allow measurement of mCherry and Alexa488 fluorescence signal intensities (3 independent experiments with ~ 120 cells analyzed from 5 representative microscopic fields per condition). Note the specific increase in cell surface-located CFTR after inhibitor treatment. Data shown in b and d represent means ± SEM (n ≥ 3).Significance was determined using one-way ANOVA (both P < 0.001), followed by post hoc Tukey’s tests (**P < 0.01)

