Fig. 1.
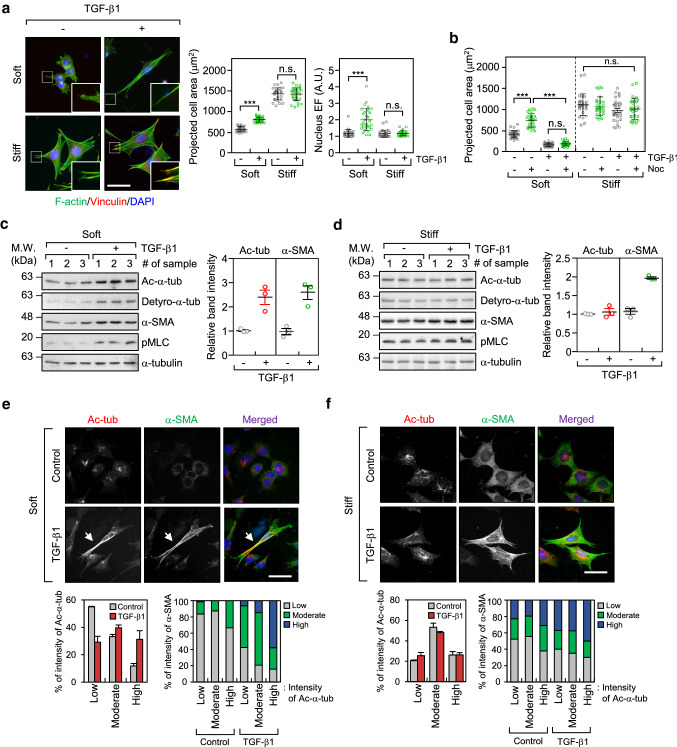
TGF-β1 increases microtubule acetylation on soft matrices. a Mouse embryonic fibroblasts (MEFs) were seeded on soft (0.5 kPa PAGs) and stiff (glass) conditions, stimulated with TGF-β1 (2 ng ml−1) for 8 h, and then labelled using an antibody specific for vinculin and Alexa Fluor® 488 phalloidin. Data are represented as means ± S.D. from two independent experiments (n = 30). Statistical analysis was performed by one-way ANOVA with Tukey’s multiple comparison test. ***p < 0.005, n.s. not significant. Projected cell area: one-way ANOVA, F3, 116 = 423.8, Nucleus EF: one-way ANOVA, F3, 116 = 35.28. Scale bar, 50 µm. b Comparison of projected cell area upon combinational treatment using TGF-β1 and/or nocodazole (Noc; 10 µM). Data are represented as means ± S.D. from two independent experiments (n = 30). Statistical analysis was performed by one-way ANOVA with Tukey’s multiple comparison test. ***p < 0.005, n.s. not significant. One-way ANOVA, F7, 232 = 138.6. c, d Western blotting conducted to detect the level of post-translational modifications including acetylation and detyrosination, α-tubulin and α-SMA in TGF-β1-treated MEFs incubated on soft (c) and stiff (d) matrices. Protein lysates obtained from MEFs grown on soft and stiff, were prepared independently. Graph shows relative expression of α-tubulin acetylation and α-SMA normalized to the expression of α-tubulin. e, f Immunofluorescence labelling of acetylated-α-tubulin and α-SMA in MEFs incubated on soft (e) and stiff (f) matrices upon stimulation with TGF-β1. Expression of acetylated-α-tubulin and α-SMA was categorized using fluorescence intensity (low, moderate, and high). Graphs show the percentage of α-SMA expression as increasing fluorescence intensity of acetylated-α-tubulin. Arrows indicate co-expression of acetylated-α-tubulin and α-SMA in TGF-β1-treated MEFs grown under soft conditions. Scale bar, 50 µm

