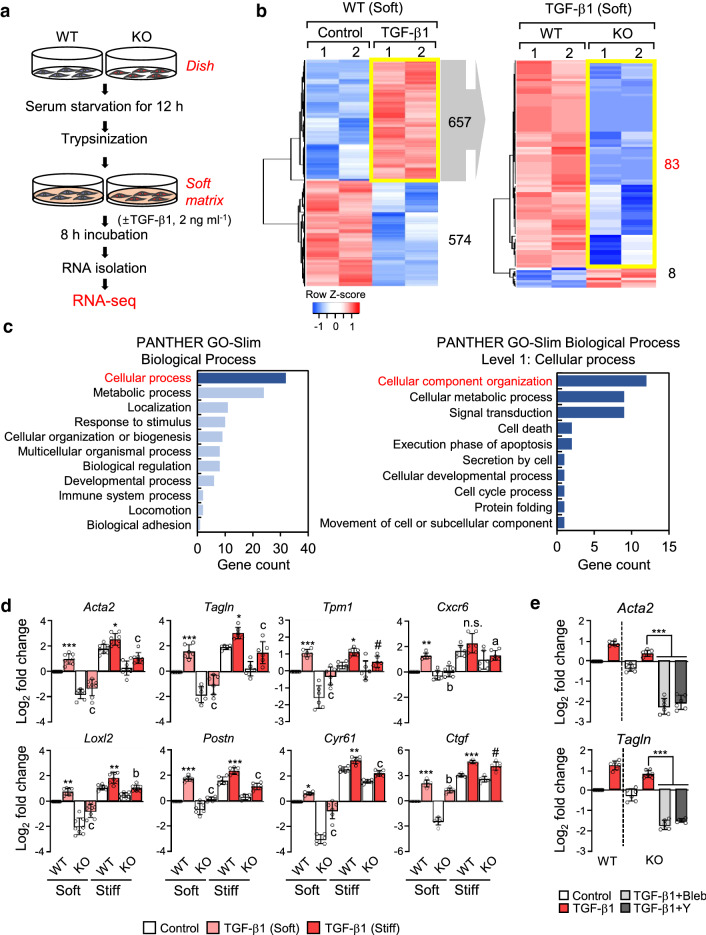
Fig. 3.
Differential gene expression in WT and α-TAT1 KO MEFs upon stimulation with TGF-β1. a Schematic diagram of the RNA-seq analysis workflow. b Left; Heatmap shows differentially expressed genes (DEGs; upregulated: 657, down-regulated: 574) in WT MEFs stimulated with TGF-β1. Right; DEGs between WT and KO upon TGF-β1 stimulation among 657 genes upregulated by TGF-β1. c Functional annotation of 83 genes selected on b (right) by PANTHER gene ontology. d Validation of myofibroblast marker genes using RT-qPCR. Data are represented as the mean of three independent experiments ± S.D. Statistical significance of the differences between the condition of TGF-β1 treated and untreated WT cells (control; *p < 0.05, **p < 0.01, ***p < 0.005, n.s. not significant) or the WT and KO cells in the condition of TGF-β1 treatment (ap < 0.05, bp < 0.01, cp < 0.005, # indicates not significant) was determined by one-way ANOVA with Tukey’s multiple comparison. All comparisons between samples were performed within each condition of soft or stiff. One-way ANOVA, F7, 56 = 89.60 (Acta2), F7, 40 = 48.92 (Tagln), F7, 40 = 26.85 (Tpm1), F7, 40 = 20.70 (Cxcr6), F7, 56 = 87.53 (Loxl2), F7, 40 = 97.13 (Postn), F7, 40 = 246.7 (Cyr61), F7, 40 = 286.3 (Ctgf). e Transcript levels of Acta2 and Tagln in α-TAT1 KO MEFs after combinational treatment with TGF-β1 and blebbistatin (Bleb)/or Y27632 (Y), incubated under stiff conditions. Data are represented the as mean ± S.D. from three independent experiments (n = 6). Statistical significance of the differences between TGF-β1 treatment and TGF-β1 + blebbistatin or TGF-β1 + Y27632 treatment in α-TAT1 KO MEFs was determined by one-way ANOVA with Tukey’s multiple comparisons. ***p < 0.005. Acta2: one-way ANOVA, F5, 30 = 178.6, Tagln: one-way ANOVA, F5, 30 = 220

