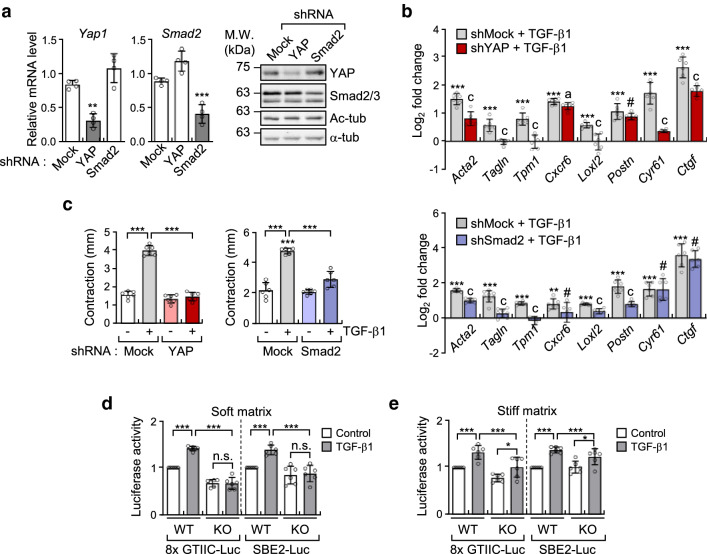
Fig. 4.
Acetylation of microtubules induced by TGF-β1 regulates myofibroblast differentiation in YAP/Smad2-dependent manner. a Transcripts and protein levels of YAP and Smad2 in MEFs expressing pLKO.1-bla-shSmad2 and pLKO.1-bla-shYAP. Data are represented the mean of two independent experiments ± S.D. (n = 4). Yap1: one-way ANOVA, F2, 9 = 31.93, Smad2: one-way ANOVA, F2, 9 = 43.41. b RT-qPCR analysis conducted to compare gene expression in MEFs expressing pLKO.1-bla-shSmad2 and pLKO.1-bla-shYAP. Relative transcript level was normalized using pLKO.1-bla-transfected cells. Data are represented as mean ± S.D. from three independent experiments (n = 6). shYAP: one-way ANOVA, F2, 15 = 102.9 (Acta2), F2, 15 = 36.21 (Tagln), F2, 15 = 37.34 (Tpm1), F2, 15 = 404.8 (Cxcr6), F2, 15 = 22.91 (Loxl2), F2, 15 = 63.34 (Postn), F2, 15 = 96.16 (Cyr61), F2, 15 = 186.6 (Ctgf). shSmad2: one-way ANOVA, F2, 15 = 514.7 (Acta2), F2, 21 = 63.72 (Tagln), F2, 15 = 76.62 (Tpm1), F2, 15 = 7.297 (Cxcr6), F2, 15 = 120.5 (Loxl2), F2, 15 = 84.94 (Postn), F2, 15 = 30.47 (Cyr61), F2, 15 = 109.6 (Ctgf). c FMC assay conducted to evaluate the activity of pLKO.1-bla-shSmad2 and pLKO.1-bla-shYAP upon stimulation with TGF-β1. Graphs indicate reduced diameter of a 3D collagen gel compared with that of the original size. Data are represented as the mean of three independent experiments ± S.D. (n = 6). shYAP; one-way ANOVA, F3, 20 = 178, shSmad2; one-way ANOVA, F3, 20 = 62.69. d, e Luciferase reporter assay conducted to measure the transcriptional activity of YAP (8xGTIIC-Luc) and Smad (SBE2-Luc). WT and KO MEFs were transfected using SBE2-Luc or 8xGTIIC-Luc with CMV-β-galactosidase for 24 h. Cells were serum starved for 12 h, seeded on fibronectin-coated soft (d) or stiff matrices (e), and incubated for 8 h with TGF-β1. Luciferase activities were normalized using the activity of β-galactosidase. Data are represented as the mean of three independent experiments ± S.D. (n = 6). Soft; 8xGTIIC-Luc: one-way ANOVA F3, 20 = 124.8, SBE2-Luc: one-way ANOVA, F3, 20 = 18.96. Stiff; 8xGTIIC-Luc: one-way ANOVA, F3, 20 = 16.36, SBE2-Luc: one-way ANOVA, F3, 20 = 16.14. Statistical analysis was performed by one-way ANOVA with Tukey’s multiple comparisons. p value p < 0.05 considered being significant. *p < 0.05, **p < 0.01, ***p < 0.005. For b, statistical significance between shMock and shYAP or shSmad2 under TGF-β1 stimulation was indicated with ap < 0.05, cp < 0.005, and #, not significant

