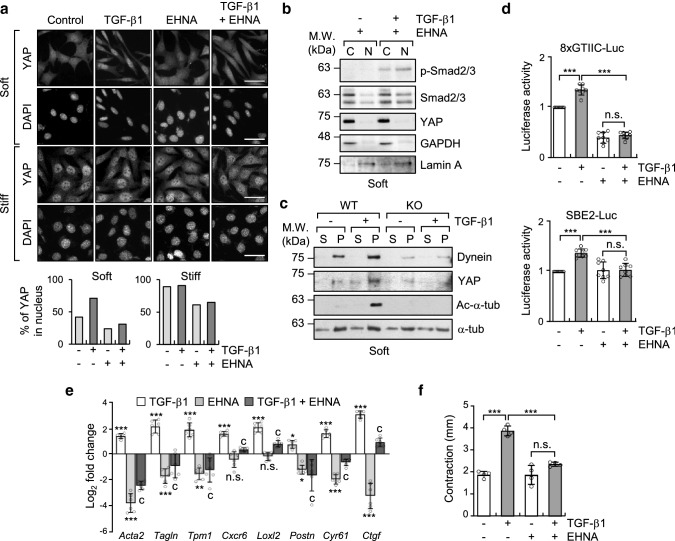
Fig. 6.
Acetylated microtubules are sufficient for dynein-dependent nuclear translocation of YAP upon stimulation with TGF-β1. a Immunolabeling of YAP localization in WT and α-TAT1 KO MEFs treated with EHNA (500 μM) and/or TGF-β1 (2 ng ml−1) and grown on fibronectin-coated soft and stiff matrices. Graphs show the percentage of YAP in the nucleus. Scale bar, 50 μm. b Western blotting analysis of nuclear and cytosolic fractions of WT MEFs treated with EHNA and/or TGF-β1 for 8 h. GAPDH and Lamin A were used as markers for cytosolic and nucleic fractions, respectively. c Microtubule sedimentation assay examining WT and α-TAT1 KO MEFs incubated on a soft matrix. Each fraction was assessed via western blotting to detect the levels of dynein and YAP. S; supernatant (depolymerized tubulin), P; pellet (polymerized tubulin). d Luciferase reporter assay in MEFs treated with TGF-β1 and EHNA and grown on 0.5 kPa PAGs. Data are represented as mean ± S.D. from three independent experiments (n = 6). 8xGTIIC-Luc: one-way ANOVA, F3, 28 = 246.9, SBE2-Luc: one-way ANOVA, F3, 28 = 19.02. *p < 0.05, **p < 0.05, ***p < 0.005, n.s. not significant. e RT-qPCR analysis of selected genes using the same conditions as those shown in a. Bar graph shows log2 fold change normalized to WT control. Data are represented as the mean of three independent experiments ± S.D. (n = 6). Statistical significance of the differences between each treatment and control group (baseline; *p < 0.05, **p < 0.05, ***p < 0.005, n.s., not significant) or between TGF-β1 treatment and EHNA + TGF-β1 (cp < 0.005) was determined by one-way ANOVA with Tukey’s multiple comparison. One-way ANOVA, F3, 20 = 201.5 (Acta2), F3, 20 = 46.30 (Tagln), F3, 20 = 41.05 (Tpm1), F3, 20 = 41.29 (Cxcr6), F3, 20 = 88.81 (Loxl2), F3, 20 = 17.29 (Postn), F3, 20 = 177.9 (Cyr61), F3, 20 = 143.1 (Ctgf). f WT MEFs were serum starved for 12 h and seeded into the collagen matrix. After 1 h, media containing TGF-β1 and/or EHNA were added into the matrices. Data are represented as the mean of two independent experiments ± S.D. (n = 4). One-way ANOVA, F3, 12 = 53.10. ***p < 0.005, n.s. not significant

