Fig. 7.
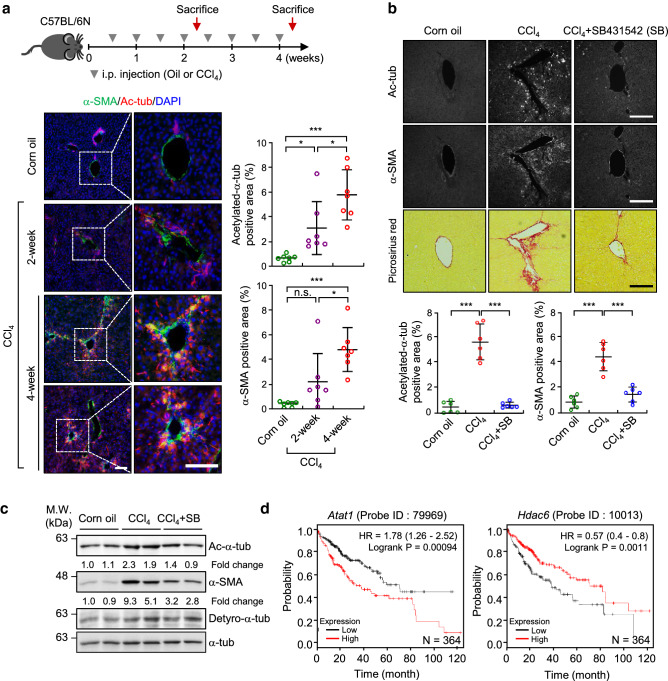
Acetylation of α-tubulin is initiated during CCl4-induced hepatic fibrosis. a Immunohistochemical (IHC) analysis of α-SMA and acetylated-α-tubulin expression in liver sections obtained from mice treated with corn oil or CCl4 (0.5 ml kg−1 body weight, i.p., twice a week) for 2 and 4 weeks. Data are represented as the mean ± S.D. with n = 7 slices obtained from three mice per group. Acetylation of α-tubulin: one-way ANOVA, F2, 18 = 15.74, α-SMA: one-way ANOVA, F2, 18 = 12.27. Scale bar, 200 μm. b IHC analysis of α-SMA and acetylated-α-tubulin expression, and picrosirius red stain for thick-collagen expression, in liver sections of mice administered combined treatment with SB431542 and CCl4 (10 mg kg−1 body weight, i.p., twice a week for 4 weeks). Data are represented as the mean ± S.D. with n = 6 slices obtained from three mice per group. Acetylation of α-tubulin: one-way ANOVA, F2, 15 = 69.42, α-SMA: one-way ANOVA, F2, 15 = 36.29. *p < 0.05, ***p < 0.005, n.s. not significant. Scale bar, 200 μm. c Western blotting for detection of acetylated-α-tubulin, detyrosinated-α-tubulin and α-SMA in the liver sample obtained from b. d Survival analysis was conducted using Kaplan–Meier survival curves with respect to the expression level of Atat1 (probe ID; 79969) and Hdac6 (probe ID; 10013) in patients with hepatocellular carcinoma (HCC) (n = 364)

