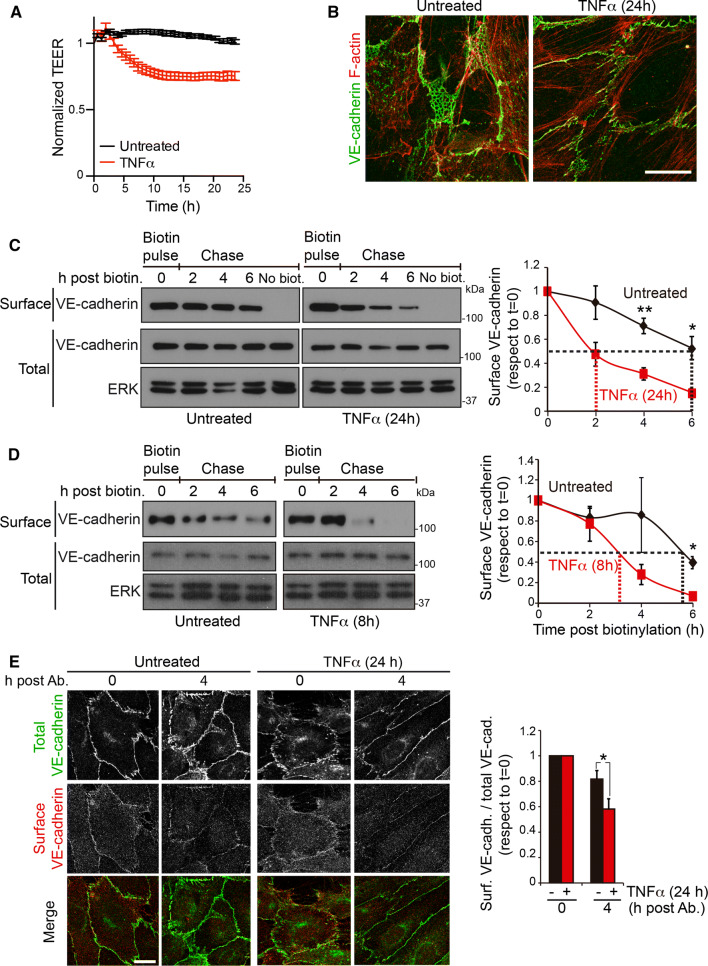
Fig. 1.
TNFα induces endothelial barrier remodeling and decreases surface VE-cadherin half-life. a HUVECs were plated at confluence for 48 h in ECIS arrays pre-coated with fibronectin, then starved for 12 h, stimulated or not with 10 ng/ml TNFα and TEER measured by ECIS. b HUVECs were cultured at confluence for 48 h on coverslips pre-coated with fibronectin, starved for 12 h and then stimulated or not with 10 ng/ml TNFα for 24 h. Cells were fixed and stained to analyze the distribution of VE-cadherin and F-actin. Scale bar, 20 μm. c, d Pulse and chase experiment of surface VE-cadherin. HUVECs were cultured at confluence for at least 48 h on dishes pre-coated with fibronectin, starved for 12 h and then stimulated or not with 10 ng/ml TNFα for 24 h (c) or for 8 h (d). Surface proteins were labeled with sulfo-NHS-biotin (biotin pulse), cells were incubated at 37 oC for the indicated times and lysed (chase). Surface-biotinylated proteins were isolated by pull-down assay with NeutrAvidin-agarose. Surface VE-cadherin levels were detected with a specific antibody from the pull-down fraction and compared with total VE-cadherin levels from the lysate. Immunoblots of ERK are shown as loading controls. Graphs show the mean + SEM from three independent experiments. Discontinuous lines mark surface VE-cadherin half-life for each condition. The t test analyzed differences between surface VE-cadherin levels in unstimulated and TNFα-stimulated cells at the indicated times *p < 0.05; **p < 0.01. e HUVECs were cultured at confluence for at least 48 h on coverslips pre-coated with fibronectin, starved for 12 h and then stimulated or not with 10 ng/ml TNFα for 24 h. Cells were then incubated in the cold with mouse anti-VE-cadherin labeling antibody (surface), as described [16]. HUVECs were then incubated at 37 oC for the indicated times, fixed, permeabilized and stained with a rabbit anti-VE-cadherin antibody (total). Scale bar, 20 μm. The right-hand graph shows the ratio between the staining intensities of total and surface-labeled VE-cadherin antibody. Graph shows the mean + SEM from four independent experiments. *p < 0.05. See also Fig. S1

