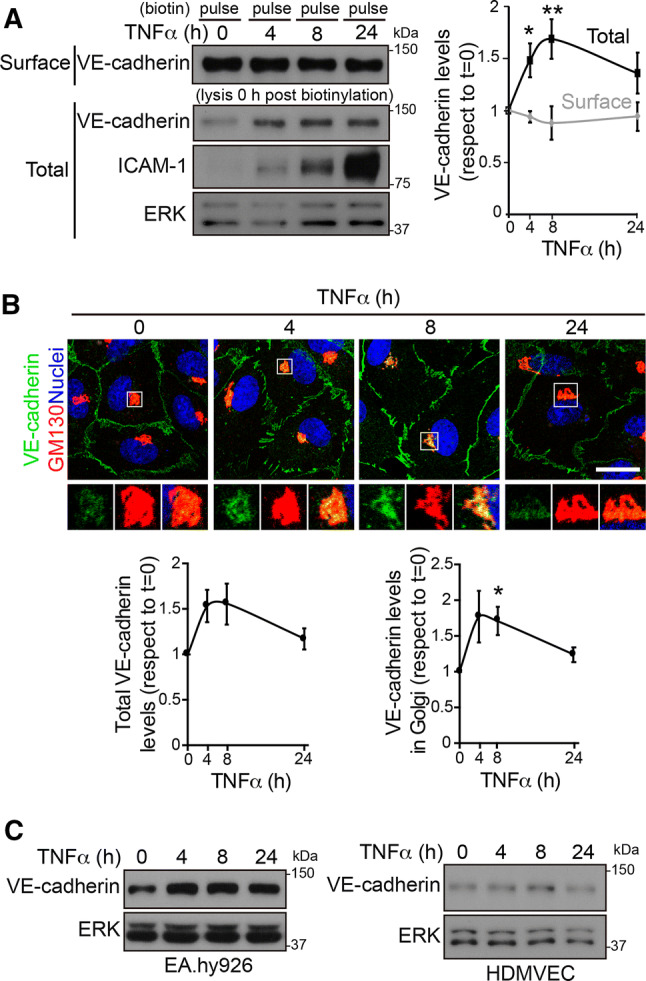
Fig. 2.

TNFα increases VE-cadherin protein expression but not surface VE-cadherin levels. a HUVECs were cultured at confluence for 48 h on dishes pre-coated with fibronectin, starved for 12 h and then stimulated with 10 ng/ml TNFα for the indicated times. Surface proteins were labeled with sulfo-NHS-biotin, and cells were immediately lysed. Surface-biotinylated proteins were isolated by pull-down assay with NeutrAvidin-agarose. Surface VE-cadherin levels were detected with specific antibodies from the pull-down fraction and compared with the expression levels from the lysates (total). ICAM-1 was immunodetected as a control for TNFα stimulation. ERK was immunoblotted as a loading control. The right-hand graph shows the quantification of the changes in total and surface VE-cadherin expression with respect to values in unstimulated cells. Graphs show the mean + SEM from three independent experiments. The t test compared differences between protein levels at the indicated timepoints of TNFα stimulation with those in unstimulated cells. *p < 0.05; **p < 0.01. b HUVECs were cultured as in (a) and stimulated with TNFα for the indicated times. Cells were fixed, permeabilized and stained with rabbit anti-VE-cadherin against the cytoplasmic VE-cadherin domain, mouse anti-GM130 antibody and DAPI to label nuclei. Scale bar, 20 μm. Bottom graphs show the quantification of changes in response to TNFα of total VE-cadherin staining intensity (left) and VE-cadherin staining intensity in the area positive for the Golgi marker GM130 (right). c Changes in VE-cadherin expression in response to TNFα stimulation in the HUVEC derived cell line EA.hy926 and in HDMVEC. ERK was immunoblotted as a loading control
