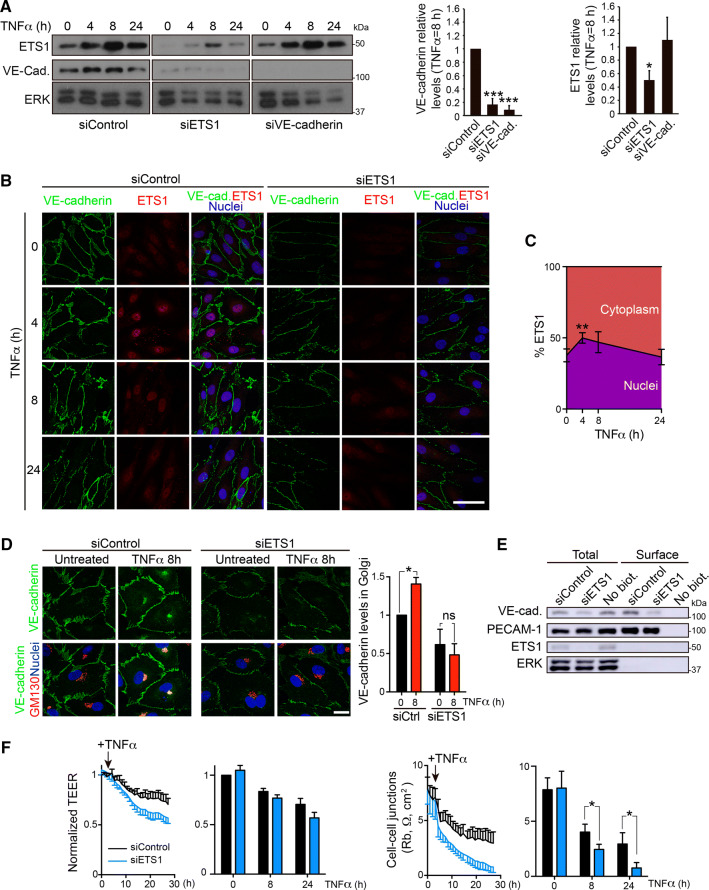
Fig. 6.
ETS1 expression is required for VE-cadherin expression and reduces TNFα-induced paracellular permeability a siRNA-mediated knockdown of ETS1 (siETS1) reduces VE-cadherin expression, whereas VE-cadherin knockdown (siVE-cadherin) does not affect ETS1 protein levels. TNFα induces similar kinetics of VE-cadherin and ETS1 protein expression. Graphs show quantifications of VE-cadherin and ETS1 levels with respect to siControl after 8 h of TNFα stimulation. Mean + SEM from three independent experiments. *p < 0.05; ***p < 0.001. b Confocal images showing the effect of TNFα stimulation and ETS1 gene silencing on VE-cadherin and ETS1 levels and ETS1 nuclear translocation. Double staining was performed with rabbit anti-ETS1 antibody and mouse anti-VE-cadherin antibody against the extracellular domain of the adhesion receptor. Scale bar, 50 μm. c Quantification of ETS1 nuclear translocation, which occurs mainly at 4 h of TNFα exposure. *p < 0.05. d Effect of ETS1 knockdown on VE-cadherin levels in the Golgi region. Double staining was performed with rabbit anti-VE-cadherin antibody against the cytoplasmic tail and mouse anti-GM130 antibody as a Golgi marker. Scale bar, 20 μm. Graph shows the quantification of VE-cadherin staining in the Golgi area performed as in Fig. 2b. ns, p > 0.05; *p < 0.05. e Effect of ETS1 knockdown on total and surface VE-cadherin levels. HUVECs were transfected with the indicated siRNA oligonucleotides. 72 h post-transfection, cells were labeled with sulfo-NHS-biotin and surface, biotinylated proteins isolated by pull-down with NeutrAvidin agarose as in Fig. 2a. Note that siETS1 has no effect on the total and surface levels of PECAM-1 and on the loading control ERK. f Effect of ETS1 knockdown on TEER decrease (left graph) and Rb value decrease (right) induced by TNFα [21]. Graphs show the mean + SEM from three independent experiments measured at the indicated times of TNFα stimulation. *p < 0.05. See Fig. S5B

