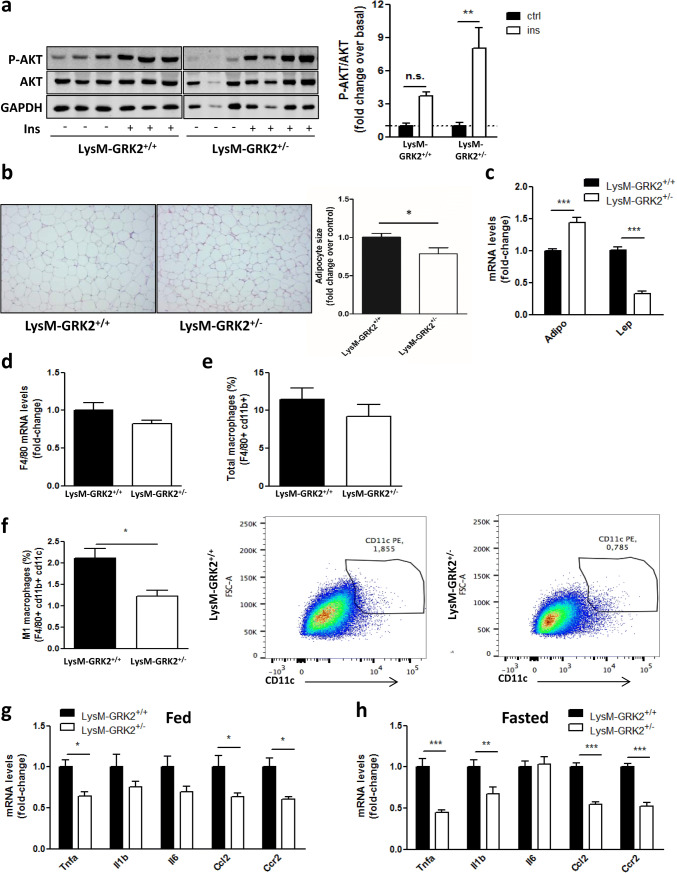
Fig. 3.
HFD-fed LysM-GRK2+/− mice show increased insulin-induced AKT phosphorylation in eWAT, together with reduced adipocyte size and a less dysfunctional adipokine and cytokine expression profile upon a HFD. Following 12 weeks of HFD, control (LysM-GRK2+/+) and LysM-GRK2+/− mice were injected vehicle (NaCl 0.9%) or insulin (1 IU/kg body weight) and after 10 min tissue lysates from eWAT were subjected to WB and probed with antibodies against total and phosphorylated AKT (Ser473). Representative immunoblots and densitometric analysis (a) of four mice per group are shown and expressed as % of stimulation over vehicle-injected mice (basal). Statistical significance was analyzed by unpaired two-tailed t test *p < 0.05. b Sections of epididymal fat pads from control and LysM-GRK2+/− mice stained with haematoxylin and eosin (10×magnification). Representative photomicrographs are shown. Adipocyte size was calculated by determining individual adipocyte areas using image analysis software (ImageJ) in 2–5 different randomly chosen fields per mouse, in 6–7 mice per genotype. Statistical significance was analyzed by unpaired two-tailed t test *p < 0.05. f Total macrophages in the adipose SVF were identified by FACS gating F4/80 and cd11b positive cells, and expressed as % from parental cells. f M1 macrophages were identified by flow cytometry, as depicted by representative images, as the CD11c-positive cells within the F4/80 and CD11b-positive cells, and expressed as % from parental cells. Data are represented as means ± SEM of 5–6 mice per genotype. eWAT lysates were subjected to real-time qPCR to measure the expression of Adiponectin and Leptin genes (c) Emr1 (F4/80) gene (d) as well as the expression of genes encoding TNFα, IL-1β, IL-6, CCL-2 (MCP-1) and CCR2 in fed (g) or overnight fasted (~ 12 h) (h) mice. qPCR results were normalized against Ppia and B2m mRNAs. Statistical significance was analyzed by unpaired two-tailed t test (c) or by one-way ANOVA followed by Bonferroni post-hoc test (f, g) (*p < 0.05; ***p < 0.005)

