Fig. 5.
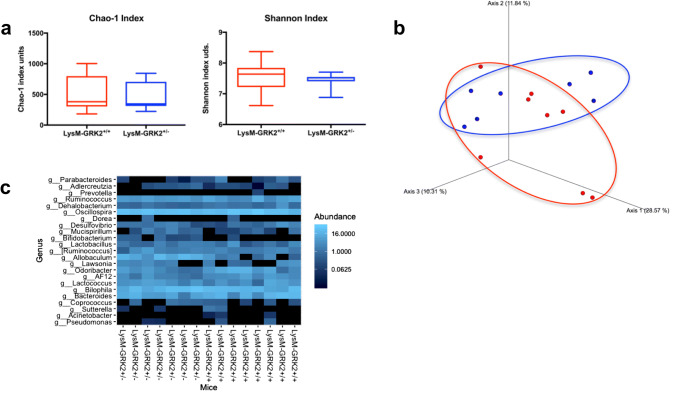
Gut microbiota analysis from LysM-GRK2+/+ and LysM-GRK2+/− mice under a HFD. a Comparison of Chao1 and Shannon diversity indexes between groups. Statistical differences were analyzed by Kruskal Wallis test. No differences were observed. b Principal coordinates analysis (PCoA) plot of Unweighted Unifrac distance of fecal samples collected after 12w from LysM-GRK2+/+ and LysM-GRK2+/− mice fed a HFD. PERMANOVA analysis did not show statistical differences between groups. c Heatmap for the effect of genetics on intestinal microbiota composition showing bacterial groups at genus level. Relative abundances of the groups are color-coded from less to more abundance

