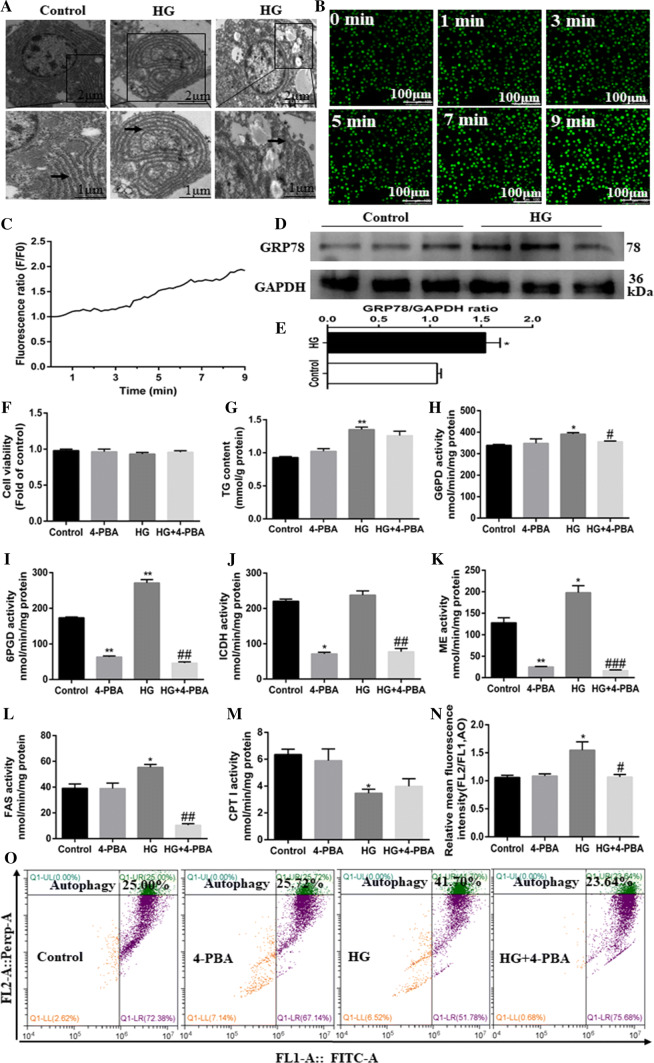
Fig. 6.
ER stress pathway mediated HG-induced lipid deposition and autophagy of the primary hepatocytes from yellow catfish. Hepatocytes were incubated in control (5-mM glucose) or HG (10-mM glucose) for 48 h in M199 medium with or without 2-h pretreatment with an ER stress inhibitor (100-μM 4-PBA). a Representative TEM images. Black arrow pointing to endoplasmic reticulum. b Representative confocal microscopy image of hepatocytes stained with Ca2+ fluorescent probe (Fluo-4 AM, 4 μM), showing a time-dependent changes in green fluorescence levels of primary hepatocytes. c Schematic represent quantification of the Fluo-4 AM staining. d, e Western blot analysis of GRP78/Bip protein levels (n = 3). f Cell viability. g TG content. h–m Activities of lipogenic (6PGD, G6PD, ICDH, ME and FAS) and lipolytic (CPTI) enzymes. n The autophagy was quantified by flow cytometric analysis of red/green (FL2/FL1) fluorescence ratio (acridine orange fluorescent staining, 1 μM). o The presence of acridine orange-stained intracellular autophagic vacuole was determined by flow cytometry analysis of red/green (FL2/FL1) fluorescence ratio. All data are expressed as mean ± S.E.M. (n = 3 at least). P value was calculated by Student’s t tests. *P < 0.05, **P < 0.01, compared with control; #P < 0.05, ##P < 0.01, ###P < 0.001, compared with HG group

