Fig. 7.
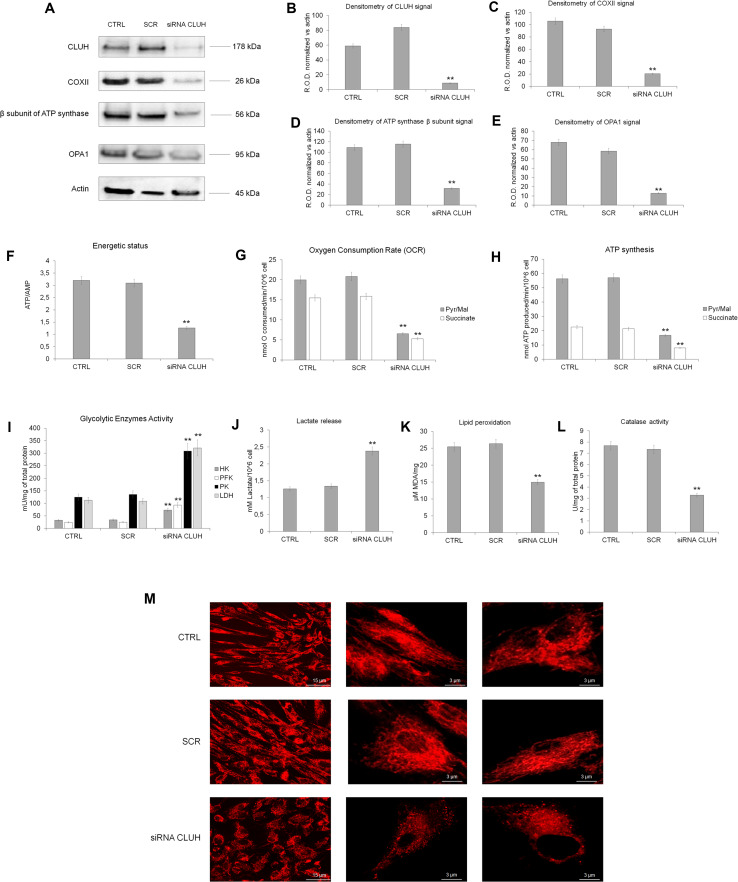
Metabolic changes in term MSCs silenced for CLUH. a Reports the WB analysis against CLUH, COX II, β subunit of ATP synthase and OPA1 in term MSCs (CTRL), scramble MSCs (SCR) and term silenced for CLUH (siRNA CLUH). b–e show the relative densitometric analyses normalized on the actin signal showed in a. The WB data are representative of at least three experiments. Double asterisk indicates a significant difference for p < 0.001 among CLUH silencing term UC-MSCs with respect to the value of term UC-MSCs (CTRL). All the metabolic analyses were performed on term MSCs (CTRL), scramble MSCs cells (SCR), and term MSCs silenced for CLUH (siRNA CLUH). The energy status in terms of ATP/AMP ratio is reported in f. The OXPHOS activity, as oxygen consumption and ATP synthesis are shown in g and h, respectively. i Reports the activity of hexokinase (HK), phosphofructokinase (PFK), pyruvate kinase (PK), and lactate dehydrogenase (LDH), while j shows the lactate released. The lipid peroxidation and the catalase activity are reported in k and l, respectively. The organization of mitochondrial reticulum was observed to confocal microscopy, using mitotracker as fluorescence probe (m). Each panel is representative of at least three experiment and double asterisk indicates a significant difference for p < 0.001 among CLUH silencing term UC-MSCs with respect to the value of term UC-MSCs (CTRL)

