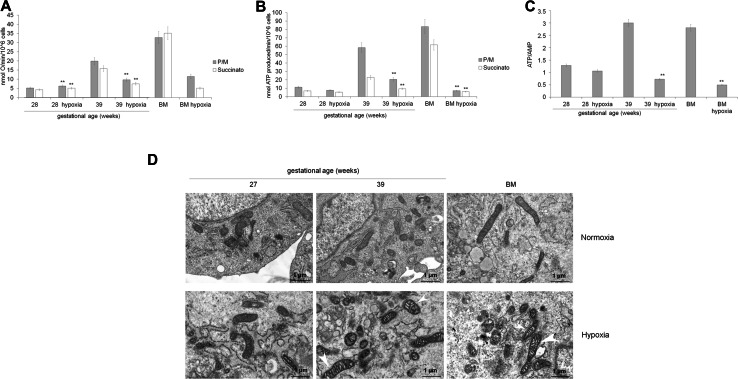
Fig. 8.
Energy metabolism, oxidative status, and mitochondrial morphology in preterm and term UC-MSCs grown in hypoxic condition. All data show a comparison of preterm (28 weeks of GA) and term (39 weeks of GA) UC-MSCs and BM-MSCs grown in normoxic or hypoxic condition (1% O2, for 48 h). a, b report the mitochondrial oxygen consumption and the ATP synthesis trough Fo–F1 ATP synthase. To stimulate the pathway composed by complexes I, III, and IV, pyruvate plus malate (Pyr/Mal; gray columns) was employed; while succinate (white columns) was used to stimulate the pathway formed by complexes II, III, and IV. c shows the ATP/AMP ratio. d Reports the TEM analysis. Mitochondria from UC-MSC (preterm) patients appeared morphologically normal before and after hypoxia treatments. On the contrary, both term than BM-MSC showed mitochondria with swelling cristae (white arrowheads) after hypoxia treatments. (Scale bars, 1 μm). Each Panel is representative of at least five experiments. Double asterisk indicates a p < 0.001 between the sample grown in hypoxia and grown in normoxia

